

34
Internet of Things (IoT)
classes was based on the most dominant class in a given cluster. It is clear that cluster 1
matches class 1 reasonably well. Similarly, cluster 3 matches class 3 reasonably well. Most
members of cluster 2 are from class 2. Cluster 0 is a little difficult to match with a class.
Most of the members from class 0 belong to cluster 0. However, the most dominant class in
cluster 0 is class 2. Since we had already assigned another cluster to class 2, we associated
cluster 0 with class 0. This assignment leads to the precision, recall, and F-measure values
are shown in Figure 2.5.
With K-means clustering, our precision is quite high for persons 1 and 3. However, the
value is very low for person 0 and middling for person 2. The likelihood of us classifying
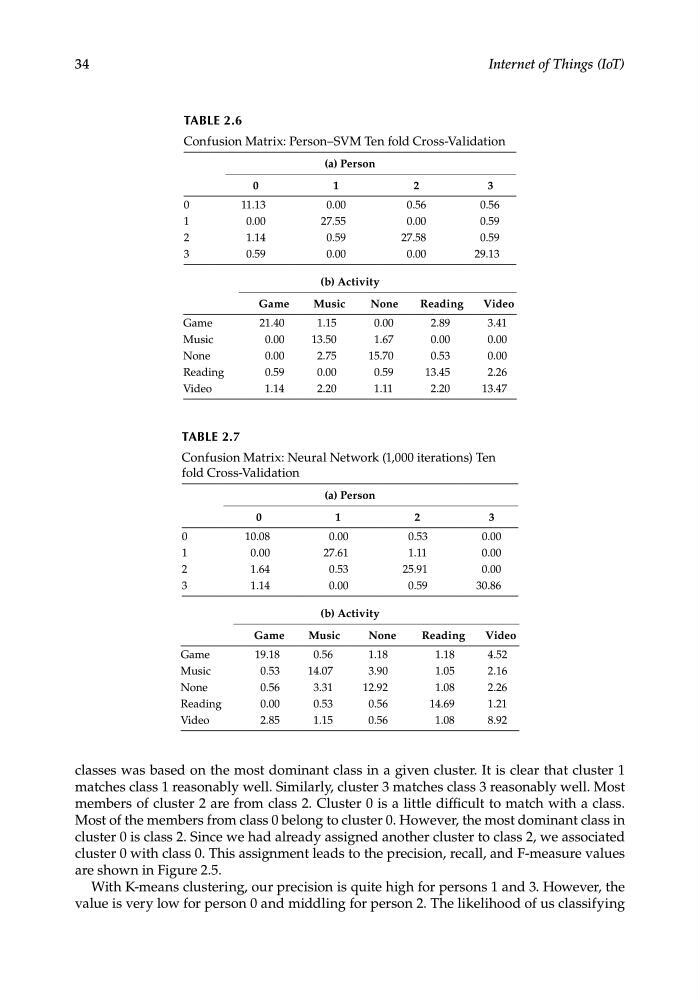
TABLE 2.6
Confusion Matrix: Person–SVM Ten fold Cross-Validation
(a) Person
0
1
2
3
0
11.13
0.00
0.56
0.56
1
0.00
27.55
0.00
0.59
2
1.14
0.59
27.58
0.59
3
0.59
0.00
0.00
29.13
(b) Activity
Game
Music
None
Reading
Video
Game
21.40
1.15
0.00
2.89
3.41
Music
0.00
13.50
1.67
0.00
0.00
None
0.00
2.75
15.70
0.53
0.00
Reading
0.59
0.00
0.59
13.45
2.26
Video
1.14
2.20
1.11
2.20
13.47
TABLE 2.7
Confusion Matrix: Neural Network (1,000 iterations) Ten
fold Cross-Validation
(a) Person
0
1
2
3
0
10.08
0.00
0.53
0.00
1
0.00
27.61
1.11
0.00
2
1.64
0.53
25.91
0.00
3
1.14
0.00
0.59
30.86
(b) Activity
Game
Music
None
Reading
Video
Game
19.18
0.56
1.18
1.18
4.52
Music
0.53
14.07
3.90
1.05
2.16
None
0.56
3.31
12.92
1.08
2.26
Reading
0.00
0.53
0.56
14.69
1.21
Video
2.85
1.15
0.56
1.08
8.92
Internet of Things (IoT)
classes was based on the most dominant class in a given cluster. It is clear that cluster 1
matches class 1 reasonably well. Similarly, cluster 3 matches class 3 reasonably well. Most
members of cluster 2 are from class 2. Cluster 0 is a little difficult to match with a class.
Most of the members from class 0 belong to cluster 0. However, the most dominant class in
cluster 0 is class 2. Since we had already assigned another cluster to class 2, we associated
cluster 0 with class 0. This assignment leads to the precision, recall, and F-measure values
are shown in Figure 2.5.
With K-means clustering, our precision is quite high for persons 1 and 3. However, the
value is very low for person 0 and middling for person 2. The likelihood of us classifying
TABLE 2.6
Confusion Matrix: Person–SVM Ten fold Cross-Validation
(a) Person
0
1
2
3
0
11.13
0.00
0.56
0.56
1
0.00
27.55
0.00
0.59
2
1.14
0.59
27.58
0.59
3
0.59
0.00
0.00
29.13
(b) Activity
Game
Music
None
Reading
Video
Game
21.40
1.15
0.00
2.89
3.41
Music
0.00
13.50
1.67
0.00
0.00
None
0.00
2.75
15.70
0.53
0.00
Reading
0.59
0.00
0.59
13.45
2.26
Video
1.14
2.20
1.11
2.20
13.47
TABLE 2.7
Confusion Matrix: Neural Network (1,000 iterations) Ten
fold Cross-Validation
(a) Person
0
1
2
3
0
10.08
0.00
0.53
0.00
1
0.00
27.61
1.11
0.00
2
1.64
0.53
25.91
0.00
3
1.14
0.00
0.59
30.86
(b) Activity
Game
Music
None
Reading
Video
Game
19.18
0.56
1.18
1.18
4.52
Music
0.53
14.07
3.90
1.05
2.16
None
0.56
3.31
12.92
1.08
2.26
Reading
0.00
0.53
0.56
14.69
1.21
Video
2.85
1.15
0.56
1.08
8.92