

33
Identification from Wearable Device Brain Signals
by person or activity, respectively. For the ten fold cross-validation confusion matrices, the
entries are percentages of table totals.
Tables 2.6(a), 2.7(a), and 2.8(a) show correctly predicting individual 0 is not as likely as the
other persons, which can be expected since individual 0 has only 23 instead of 50 records.
2.9 Semi-Supervised Evolutionary Learning Results
Table 2.9 shows the confusion matrix resulting from K-means clustering. The rows represent clusters and columns represent classes. The correspondence between clusters and
TABLE 2.5
Person+Activity: Most Significant Independent
Variables Using Random Forest Classifiers
Rank
Variable
Significance Score
1
B7.Theta.4
6.43
2
B7.Theta.3
5.02
3
B6.Beta.2
4.33
4
B1.Delta.3
4.30
5
B4.Delta.1
4.26
Individual 3
100%
B1.Beta.1 < 35
Individual 3
69%
Individual 2
31%
Individual 1
30%
Individual 3
39%
>= 35
B8.Gamma.3 < 156
>= 156
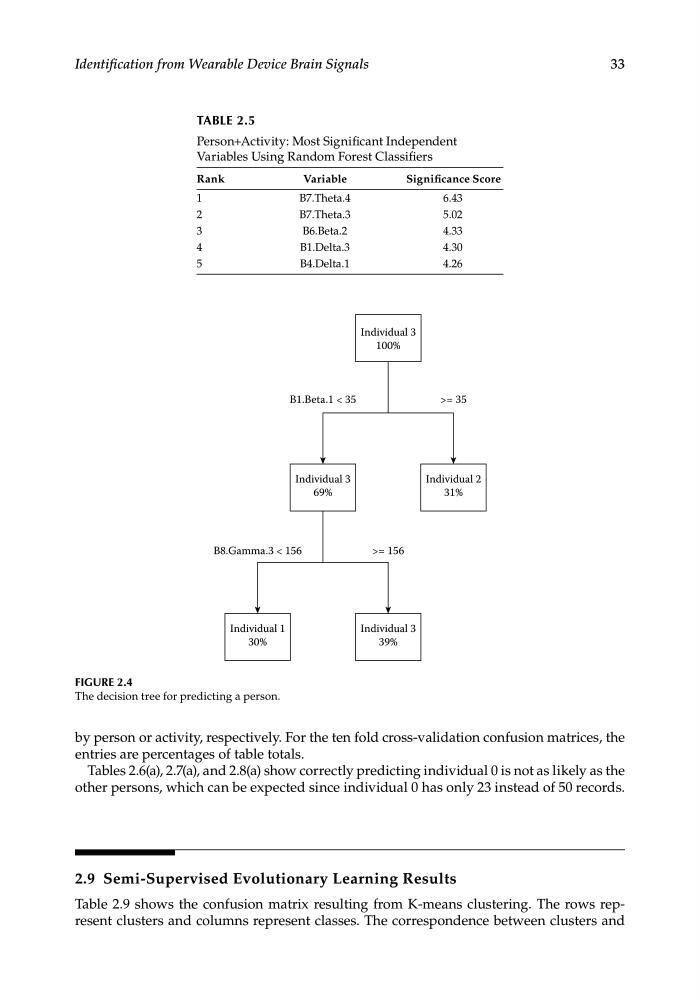
FIGURE 2.4
The decision tree for predicting a person.
Identification from Wearable Device Brain Signals
by person or activity, respectively. For the ten fold cross-validation confusion matrices, the
entries are percentages of table totals.
Tables 2.6(a), 2.7(a), and 2.8(a) show correctly predicting individual 0 is not as likely as the
other persons, which can be expected since individual 0 has only 23 instead of 50 records.
2.9 Semi-Supervised Evolutionary Learning Results
Table 2.9 shows the confusion matrix resulting from K-means clustering. The rows represent clusters and columns represent classes. The correspondence between clusters and
TABLE 2.5
Person+Activity: Most Significant Independent
Variables Using Random Forest Classifiers
Rank
Variable
Significance Score
1
B7.Theta.4
6.43
2
B7.Theta.3
5.02
3
B6.Beta.2
4.33
4
B1.Delta.3
4.30
5
B4.Delta.1
4.26
Individual 3
100%
B1.Beta.1 < 35
Individual 3
69%
Individual 2
31%
Individual 1
30%
Individual 3
39%
>= 35
B8.Gamma.3 < 156
>= 156
FIGURE 2.4
The decision tree for predicting a person.