

32
Internet of Things (IoT)
Our tests from training on the entire dataset showed SVM and random forest were able
to successfully predict a class for person, activity, or person and activity with 100% precision. Furthermore, neural networks were also able to predict person with 100% and activity with 95% accuracy, although it did not perform well for predicting person and activity
together. Overfitting was most prominent for predicting activity; however, the precision
values remained fairly high after switching to using ten fold cross-validation.
Precision tells us the likelihood of the classifier being correct when predicting a class.
Precision can be calculated by dividing the diagonal value in a row by the sum of the row
of a confusion matrix [32]. The precision values for ten fold cross-validation are all above
92% for predicting the person with SVM, neural networks, or random forest. In comparison, the precision values for the decision tree classifiers showed that they do not perform
well using our knowledge representation of the EEG data and at best only achieve a precision of 65%.
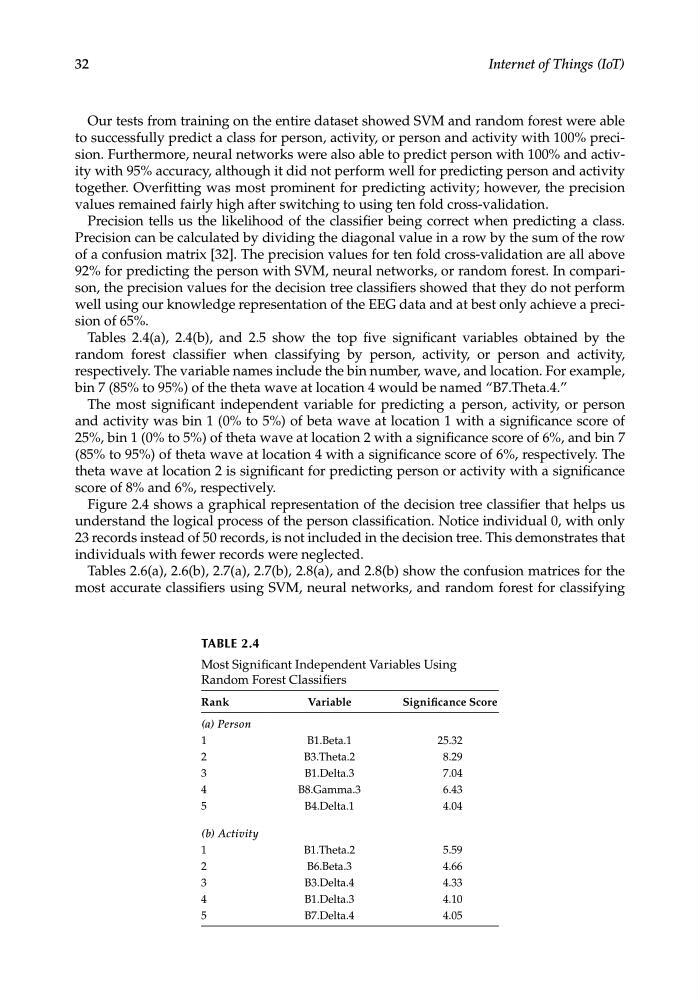
Tables 2.4(a), 2.4(b), and 2.5 show the top five significant variables obtained by the
random forest classifier when classifying by person, activity, or person and activity,
respectively. The variable names include the bin number, wave, and location. For example,
bin 7 (85% to 95%) of the theta wave at location 4 would be named “B7.Theta.4.”
The most significant independent variable for predicting a person, activity, or person
and activity was bin 1 (0% to 5%) of beta wave at location 1 with a significance score of
25%, bin 1 (0% to 5%) of theta wave at location 2 with a significance score of 6%, and bin 7
(85% to 95%) of theta wave at location 4 with a significance score of 6%, respectively. The
theta wave at location 2 is significant for predicting person or activity with a significance
score of 8% and 6%, respectively.
Figure 2.4 shows a graphical representation of the decision tree classifier that helps us
understand the logical process of the person classification. Notice individual 0, with only
23 records instead of 50 records, is not included in the decision tree. This demonstrates that
individuals with fewer records were neglected.
Tables 2.6(a), 2.6(b), 2.7(a), 2.7(b), 2.8(a), and 2.8(b) show the confusion matrices for the
most accurate classifiers using SVM, neural networks, and random forest for classifying
TABLE 2.4
Most Significant Independent Variables Using
Random Forest Classifiers
Rank
Variable
Significance Score
(a) Person
1
B1.Beta.1
25.32
2
B3.Theta.2
8.29
3
B1.Delta.3
7.04
4
B8.Gamma.3
6.43
5
B4.Delta.1
4.04
(b) Activity
1
B1.Theta.2
5.59
2
B6.Beta.3
4.66
3
B3.Delta.4
4.33
4
B1.Delta.3
4.10
5
B7.Delta.4
4.05
Internet of Things (IoT)
Our tests from training on the entire dataset showed SVM and random forest were able
to successfully predict a class for person, activity, or person and activity with 100% precision. Furthermore, neural networks were also able to predict person with 100% and activity with 95% accuracy, although it did not perform well for predicting person and activity
together. Overfitting was most prominent for predicting activity; however, the precision
values remained fairly high after switching to using ten fold cross-validation.
Precision tells us the likelihood of the classifier being correct when predicting a class.
Precision can be calculated by dividing the diagonal value in a row by the sum of the row
of a confusion matrix [32]. The precision values for ten fold cross-validation are all above
92% for predicting the person with SVM, neural networks, or random forest. In comparison, the precision values for the decision tree classifiers showed that they do not perform
well using our knowledge representation of the EEG data and at best only achieve a precision of 65%.
Tables 2.4(a), 2.4(b), and 2.5 show the top five significant variables obtained by the
random forest classifier when classifying by person, activity, or person and activity,
respectively. The variable names include the bin number, wave, and location. For example,
bin 7 (85% to 95%) of the theta wave at location 4 would be named “B7.Theta.4.”
The most significant independent variable for predicting a person, activity, or person
and activity was bin 1 (0% to 5%) of beta wave at location 1 with a significance score of
25%, bin 1 (0% to 5%) of theta wave at location 2 with a significance score of 6%, and bin 7
(85% to 95%) of theta wave at location 4 with a significance score of 6%, respectively. The
theta wave at location 2 is significant for predicting person or activity with a significance
score of 8% and 6%, respectively.
Figure 2.4 shows a graphical representation of the decision tree classifier that helps us
understand the logical process of the person classification. Notice individual 0, with only
23 records instead of 50 records, is not included in the decision tree. This demonstrates that
individuals with fewer records were neglected.
Tables 2.6(a), 2.6(b), 2.7(a), 2.7(b), 2.8(a), and 2.8(b) show the confusion matrices for the
most accurate classifiers using SVM, neural networks, and random forest for classifying
TABLE 2.4
Most Significant Independent Variables Using
Random Forest Classifiers
Rank
Variable
Significance Score
(a) Person
1
B1.Beta.1
25.32
2
B3.Theta.2
8.29
3
B1.Delta.3
7.04
4
B8.Gamma.3
6.43
5
B4.Delta.1
4.04
(b) Activity
1
B1.Theta.2
5.59
2
B6.Beta.3
4.66
3
B3.Delta.4
4.33
4
B1.Delta.3
4.10
5
B7.Delta.4
4.05