

31
Identification from Wearable Device Brain Signals
partial genomes. The children genomes are generated by swapping the middle partial
genome, between the two points, of the parents’ genomes [29].
The parameters for rough clustering were set as follows: threshold = 1.1, w u = 0.7; w l = 0.3. For
multi-objective optimization, the weight for distance-based optimization w d was set at 0.75,
and the weight for classification w c was equal to 0.25. Since the assignment of patterns to clusters is based on distance measure, the distance tended to influence the optimization more
than the wrong classification. Therefore, the evolutionary semi-supervised crisp and rough
clustering was run multiple times and solutions that provided the best classifications were
chosen. These multiple runs also allowed us to steer out of locally optimal solutions.
The primary objective of this experiment was to explore the effectiveness of Euclidean
distance between brain signals to identify an individual person. The hypothesis was that
signals from an individual will be similar and belong to the same cluster. The hypothesis
can be tested with the well-known K-means clustering algorithm. The K-means clustering algorithm was selected because of its simplicity. Furthermore, the study explored the
possibility of influencing the clustering with the known categorization using evolutionary
crisp and rough K-medoid algorithms. We used confusion matrices for detailed analysis
and the precision of clustering in identifying the individuals as two evaluation measures.
2.8 Classification Results
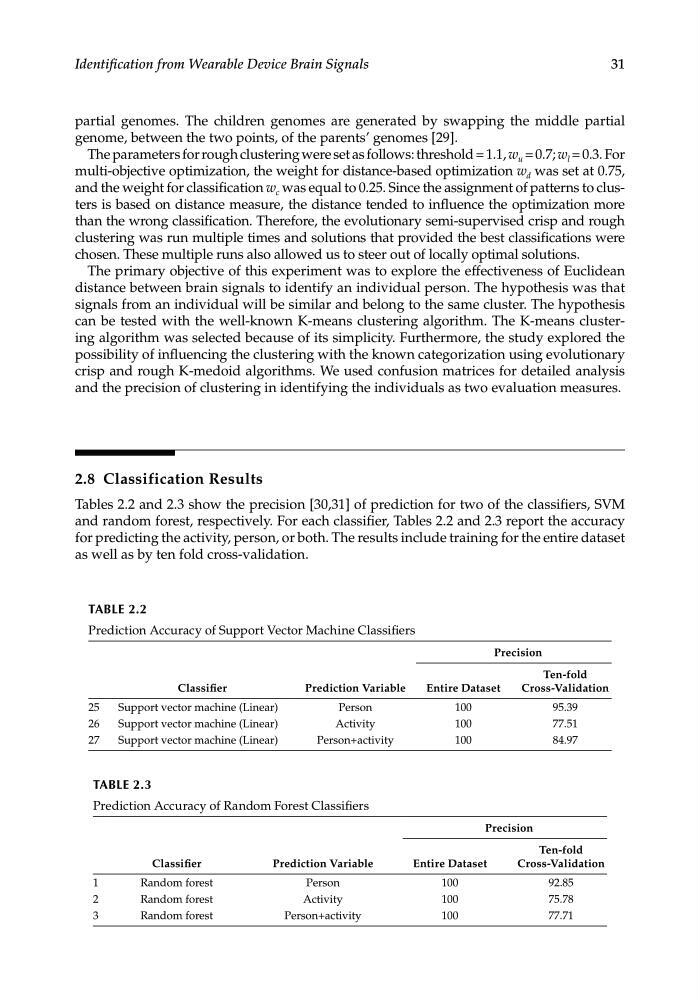
Tables 2.2 and 2.3 show the precision [30,31] of prediction for two of the classifiers, SVM
and random forest, respectively. For each classifier, Tables 2.2 and 2.3 report the accuracy
for predicting the activity, person, or both. The results include training for the entire dataset
as well as by ten fold cross-validation.
TABLE 2.2
Prediction Accuracy of Support Vector Machine Classifiers
Classifier
Prediction Variable
Precision
Entire Dataset
Ten-fold
Cross-Validation
25
Support vector machine (Linear)
Person
100
95.39
26
Support vector machine (Linear)
Activity
100
77.51
27
Support vector machine (Linear)
Person+activity
100
84.97
TABLE 2.3
Prediction Accuracy of Random Forest Classifiers
Classifier
Prediction Variable
Precision
Entire Dataset
Ten-fold
Cross-Validation
1
Random forest
Person
100
92.85
2
Random forest
Activity
100
75.78
3
Random forest
Person+activity
100
77.71
Identification from Wearable Device Brain Signals
partial genomes. The children genomes are generated by swapping the middle partial
genome, between the two points, of the parents’ genomes [29].
The parameters for rough clustering were set as follows: threshold = 1.1, w u = 0.7; w l = 0.3. For
multi-objective optimization, the weight for distance-based optimization w d was set at 0.75,
and the weight for classification w c was equal to 0.25. Since the assignment of patterns to clusters is based on distance measure, the distance tended to influence the optimization more
than the wrong classification. Therefore, the evolutionary semi-supervised crisp and rough
clustering was run multiple times and solutions that provided the best classifications were
chosen. These multiple runs also allowed us to steer out of locally optimal solutions.
The primary objective of this experiment was to explore the effectiveness of Euclidean
distance between brain signals to identify an individual person. The hypothesis was that
signals from an individual will be similar and belong to the same cluster. The hypothesis
can be tested with the well-known K-means clustering algorithm. The K-means clustering algorithm was selected because of its simplicity. Furthermore, the study explored the
possibility of influencing the clustering with the known categorization using evolutionary
crisp and rough K-medoid algorithms. We used confusion matrices for detailed analysis
and the precision of clustering in identifying the individuals as two evaluation measures.
2.8 Classification Results
Tables 2.2 and 2.3 show the precision [30,31] of prediction for two of the classifiers, SVM
and random forest, respectively. For each classifier, Tables 2.2 and 2.3 report the accuracy
for predicting the activity, person, or both. The results include training for the entire dataset
as well as by ten fold cross-validation.
TABLE 2.2
Prediction Accuracy of Support Vector Machine Classifiers
Classifier
Prediction Variable
Precision
Entire Dataset
Ten-fold
Cross-Validation
25
Support vector machine (Linear)
Person
100
95.39
26
Support vector machine (Linear)
Activity
100
77.51
27
Support vector machine (Linear)
Person+activity
100
84.97
TABLE 2.3
Prediction Accuracy of Random Forest Classifiers
Classifier
Prediction Variable
Precision
Entire Dataset
Ten-fold
Cross-Validation
1
Random forest
Person
100
92.85
2
Random forest
Activity
100
75.78
3
Random forest
Person+activity
100
77.71