

82
T. Krykowski
a
b
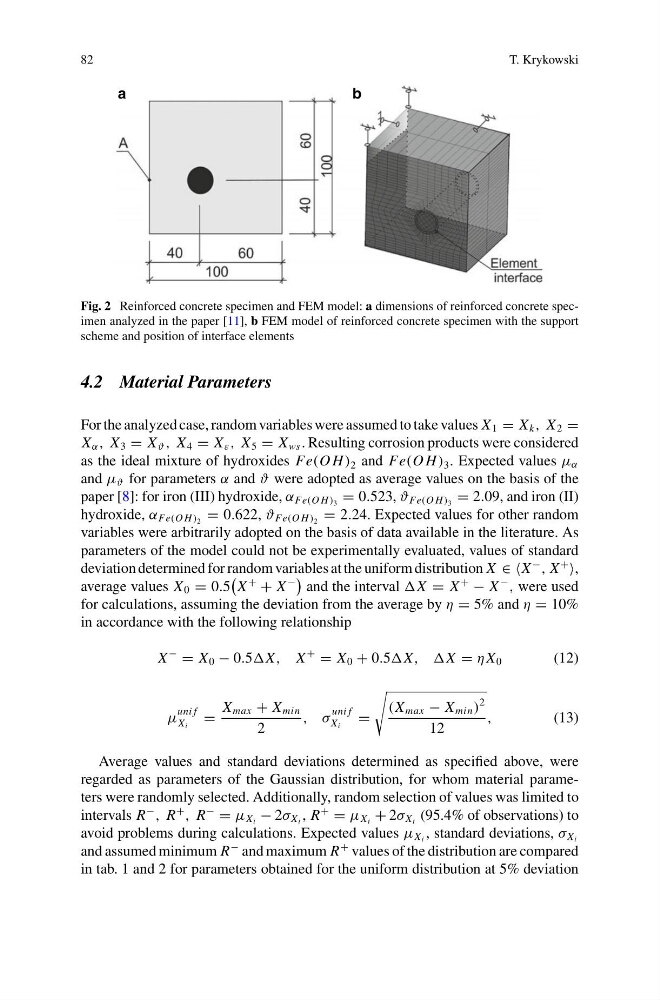
Fig. 2 Reinforced concrete specimen and FEM model: a dimensions of reinforced concrete specimen analyzed in the paper [11], b FEM model of reinforced concrete specimen with the support
scheme and position of interface elements
4.2 Material Parameters
For the analyzed case, random variables were assumed to take values X 1 = X k , X 2 =
X α , X 3 = X ϑ , X 4 = X ε , X 5 = X ws . Resulting corrosion products were considered
as the ideal mixture of hydroxides Fe(O H) 2 and Fe(O H) 3 . Expected values μ α
and μ ϑ for parameters α and ϑ were adopted as average values on the basis of the
paper [8]: for iron (III) hydroxide, α Fe(O H) 3 = 0.523, ϑ Fe(O H) 3 = 2.09, and iron (II)
hydroxide, α Fe(O H) 2 = 0.622, ϑ Fe(O H) 2 = 2.24. Expected values for other random
variables were arbitrarily adopted on the basis of data available in the literature. As
parameters of the model could not be experimentally evaluated, values of standard
deviation determined for random variables at the uniform distribution X ∈ ∈X
−
, X
+
,
average values X 0 = 0.5
X
+
+ X
−
and the interval X = X
+
− X
−
, were used
for calculations, assuming the deviation from the average by η = 5% and η = 10%
in accordance with the following relationship
X
−
= X 0 − 0.5X, X
+
= X 0 + 0.5X, ,X = ηX 0
(12)
μ
uni f
X i
=
X max + X min
2
, σ
uni f
X i
=
(X max − X min )
2
12
,
(13)
Average values and standard deviations determined as specified above, were
regarded as parameters of the Gaussian distribution, for whom material parameters were randomly selected. Additionally, random selection of values was limited to
intervals R
−
, R
+
, R
−
= μ X i − 2σ X i , R
+
= μ X i + 2σ X i (95.4% of observations) to
avoid problems during calculations. Expected values μ X i , standard deviations, σ X i
and assumed minimum R
− and maximum R
+ values of the distribution are compared
in tab. 1 and 2 for parameters obtained for the uniform distribution at 5% deviation
T. Krykowski
a
b
Fig. 2 Reinforced concrete specimen and FEM model: a dimensions of reinforced concrete specimen analyzed in the paper [11], b FEM model of reinforced concrete specimen with the support
scheme and position of interface elements
4.2 Material Parameters
For the analyzed case, random variables were assumed to take values X 1 = X k , X 2 =
X α , X 3 = X ϑ , X 4 = X ε , X 5 = X ws . Resulting corrosion products were considered
as the ideal mixture of hydroxides Fe(O H) 2 and Fe(O H) 3 . Expected values μ α
and μ ϑ for parameters α and ϑ were adopted as average values on the basis of the
paper [8]: for iron (III) hydroxide, α Fe(O H) 3 = 0.523, ϑ Fe(O H) 3 = 2.09, and iron (II)
hydroxide, α Fe(O H) 2 = 0.622, ϑ Fe(O H) 2 = 2.24. Expected values for other random
variables were arbitrarily adopted on the basis of data available in the literature. As
parameters of the model could not be experimentally evaluated, values of standard
deviation determined for random variables at the uniform distribution X ∈ ∈X
−
, X
+
,
average values X 0 = 0.5
X
+
+ X
−
and the interval X = X
+
− X
−
, were used
for calculations, assuming the deviation from the average by η = 5% and η = 10%
in accordance with the following relationship
X
−
= X 0 − 0.5X, X
+
= X 0 + 0.5X, ,X = ηX 0
(12)
μ
uni f
X i
=
X max + X min
2
, σ
uni f
X i
=
(X max − X min )
2
12
,
(13)
Average values and standard deviations determined as specified above, were
regarded as parameters of the Gaussian distribution, for whom material parameters were randomly selected. Additionally, random selection of values was limited to
intervals R
−
, R
+
, R
−
= μ X i − 2σ X i , R
+
= μ X i + 2σ X i (95.4% of observations) to
avoid problems during calculations. Expected values μ X i , standard deviations, σ X i
and assumed minimum R
− and maximum R
+ values of the distribution are compared
in tab. 1 and 2 for parameters obtained for the uniform distribution at 5% deviation