

The Application of Monte Carlo Method …
81
whose elements are randomly selected values of correlated random variables with
the expected value μ X i and standard deviation σ X i .
4 Analysis of the Calculation Example
4.1 Assumption for the Model
The evaluation was made for the width of the crack in a cube (Fig. 1a) with dimensions
of 80 × 100 × 100 mm reinforced with a steel bar φ20, length L = 8 cm, connected
into an electrolyzer generating 20 V DC. Voltage was kept for 17 days and measurements were recorded every minute. Results of the above tests were presented in the
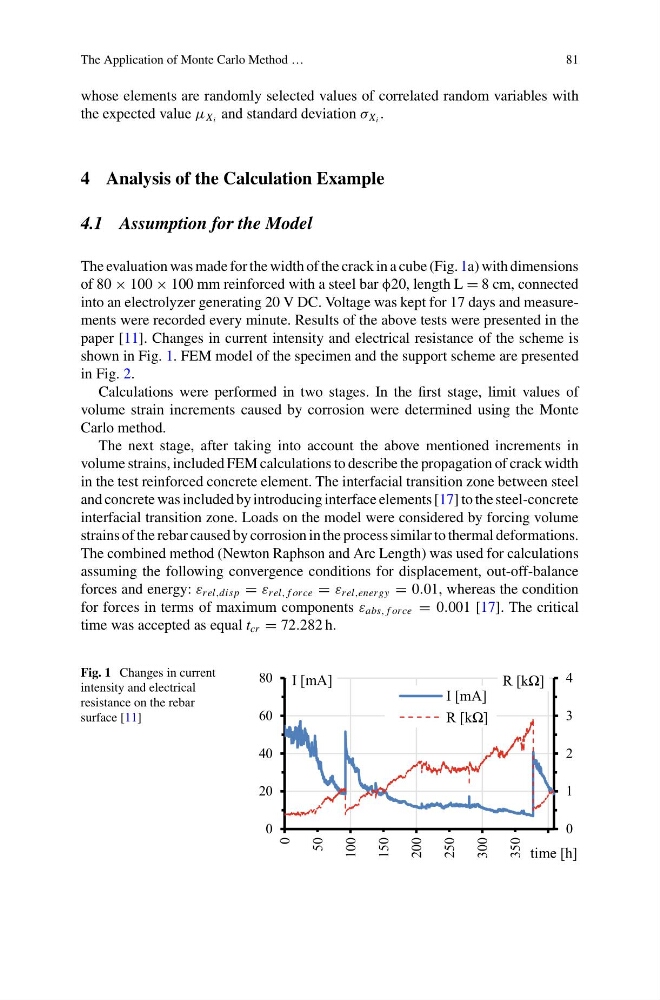
paper [11]. Changes in current intensity and electrical resistance of the scheme is
shown in Fig. 1. FEM model of the specimen and the support scheme are presented
in Fig. 2.
Calculations were performed in two stages. In the first stage, limit values of
volume strain increments caused by corrosion were determined using the Monte
Carlo method.
The next stage, after taking into account the above mentioned increments in
volume strains, included FEM calculations to describe the propagation of crack width
in the test reinforced concrete element. The interfacial transition zone between steel
and concrete was included by introducing interface elements [17] to the steel-concrete
interfacial transition zone. Loads on the model were considered by forcing volume
strains of the rebar caused by corrosion in the process similar to thermal deformations.
The combined method (Newton Raphson and Arc Length) was used for calculations
assuming the following convergence conditions for displacement, out-off-balance
forces and energy: ε rel,disp = ε rel, f orce = ε rel,energy = 0.01, whereas the condition
for forces in terms of maximum components ε abs, f orce = 0.001 [17]. The critical
time was accepted as equal t cr = 72.282 h.
Fig. 1 Changes in current
intensity and electrical
resistance on the rebar
surface [11]
0
1
2
3
4
0
20
40
60
80
0
50
100
150
200
250
300
350
R [kΩ]
I [mA]
time [h]
I [mA]
R [kΩ]
81
whose elements are randomly selected values of correlated random variables with
the expected value μ X i and standard deviation σ X i .
4 Analysis of the Calculation Example
4.1 Assumption for the Model
The evaluation was made for the width of the crack in a cube (Fig. 1a) with dimensions
of 80 × 100 × 100 mm reinforced with a steel bar φ20, length L = 8 cm, connected
into an electrolyzer generating 20 V DC. Voltage was kept for 17 days and measurements were recorded every minute. Results of the above tests were presented in the
paper [11]. Changes in current intensity and electrical resistance of the scheme is
shown in Fig. 1. FEM model of the specimen and the support scheme are presented
in Fig. 2.
Calculations were performed in two stages. In the first stage, limit values of
volume strain increments caused by corrosion were determined using the Monte
Carlo method.
The next stage, after taking into account the above mentioned increments in
volume strains, included FEM calculations to describe the propagation of crack width
in the test reinforced concrete element. The interfacial transition zone between steel
and concrete was included by introducing interface elements [17] to the steel-concrete
interfacial transition zone. Loads on the model were considered by forcing volume
strains of the rebar caused by corrosion in the process similar to thermal deformations.
The combined method (Newton Raphson and Arc Length) was used for calculations
assuming the following convergence conditions for displacement, out-off-balance
forces and energy: ε rel,disp = ε rel, f orce = ε rel,energy = 0.01, whereas the condition
for forces in terms of maximum components ε abs, f orce = 0.001 [17]. The critical
time was accepted as equal t cr = 72.282 h.
Fig. 1 Changes in current
intensity and electrical
resistance on the rebar
surface [11]
0
1
2
3
4
0
20
40
60
80
0
50
100
150
200
250
300
350
R [kΩ]
I [mA]
time [h]
I [mA]
R [kΩ]