

The Application of Monte Carlo Method …
83
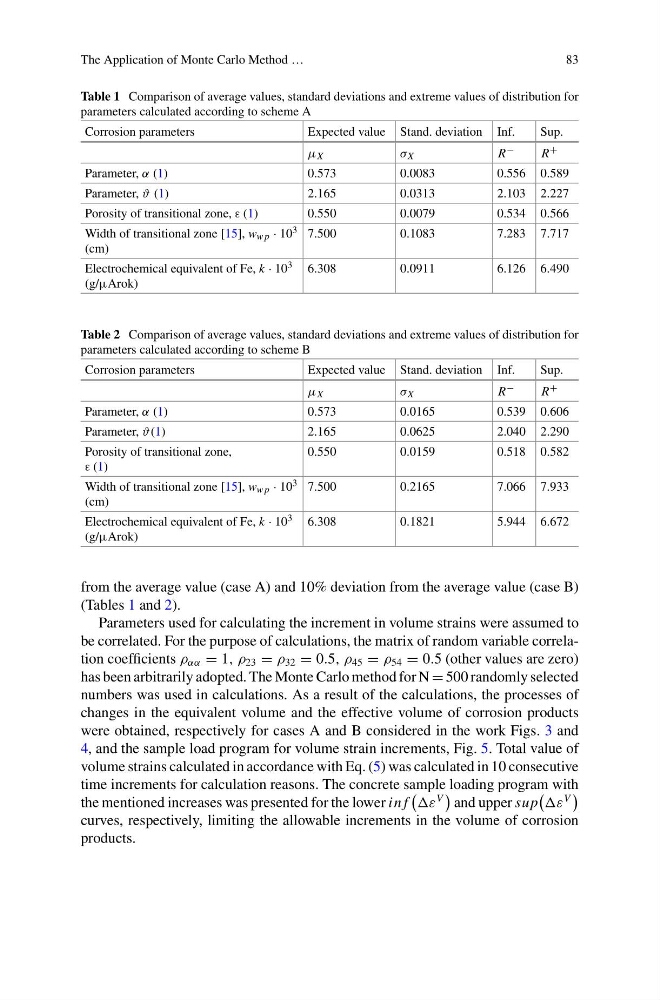
Table 1 Comparison of average values, standard deviations and extreme values of distribution for
parameters calculated according to scheme A
Corrosion parameters
Expected value Stand. deviation Inf.
Sup.
μ X
σ X
R −
R +
Parameter, α (1)
0.573
0.0083
0.556 0.589
Parameter, ϑ (1)
2.165
0.0313
2.103 2.227
Porosity of transitional zone, ε (1)
0.550
0.0079
0.534 0.566
Width of transitional zone [15], w w p · 10 3
(cm)
7.500
0.1083
7.283 7.717
Electrochemical equivalent of Fe, k · 10 3
(g/μArok)
6.308
0.0911
6.126 6.490
Table 2 Comparison of average values, standard deviations and extreme values of distribution for
parameters calculated according to scheme B
Corrosion parameters
Expected value Stand. deviation Inf.
Sup.
μ X
σ X
R −
R +
Parameter, α (1)
0.573
0.0165
0.539 0.606
Parameter, ϑ(1)
2.165
0.0625
2.040 2.290
Porosity of transitional zone,
ε (1)
0.550
0.0159
0.518 0.582
Width of transitional zone [15], w w p · 10 3
(cm)
7.500
0.2165
7.066 7.933
Electrochemical equivalent of Fe, k · 10 3
(g/μArok)
6.308
0.1821
5.944 6.672
from the average value (case A) and 10% deviation from the average value (case B)
(Tables 1 and 2).
Parameters used for calculating the increment in volume strains were assumed to
be correlated. For the purpose of calculations, the matrix of random variable correlation coefficients ρ αα = 1, ρ 23 = ρ 32 = 0.5, ρ 45 = ρ 54 = 0.5 (other values are zero)
has been arbitrarily adopted. The Monte Carlo method for N = 500 randomly selected
numbers was used in calculations. As a result of the calculations, the processes of
changes in the equivalent volume and the effective volume of corrosion products
were obtained, respectively for cases A and B considered in the work Figs. 3 and
4, and the sample load program for volume strain increments, Fig. 5. Total value of
volume strains calculated in accordance with Eq. (5) was calculated in 10 consecutive
time increments for calculation reasons. The concrete sample loading program with
the mentioned increases was presented for the lower in f
ε
V
and upper sup
ε
V
curves, respectively, limiting the allowable increments in the volume of corrosion
products.
83
Table 1 Comparison of average values, standard deviations and extreme values of distribution for
parameters calculated according to scheme A
Corrosion parameters
Expected value Stand. deviation Inf.
Sup.
μ X
σ X
R −
R +
Parameter, α (1)
0.573
0.0083
0.556 0.589
Parameter, ϑ (1)
2.165
0.0313
2.103 2.227
Porosity of transitional zone, ε (1)
0.550
0.0079
0.534 0.566
Width of transitional zone [15], w w p · 10 3
(cm)
7.500
0.1083
7.283 7.717
Electrochemical equivalent of Fe, k · 10 3
(g/μArok)
6.308
0.0911
6.126 6.490
Table 2 Comparison of average values, standard deviations and extreme values of distribution for
parameters calculated according to scheme B
Corrosion parameters
Expected value Stand. deviation Inf.
Sup.
μ X
σ X
R −
R +
Parameter, α (1)
0.573
0.0165
0.539 0.606
Parameter, ϑ(1)
2.165
0.0625
2.040 2.290
Porosity of transitional zone,
ε (1)
0.550
0.0159
0.518 0.582
Width of transitional zone [15], w w p · 10 3
(cm)
7.500
0.2165
7.066 7.933
Electrochemical equivalent of Fe, k · 10 3
(g/μArok)
6.308
0.1821
5.944 6.672
from the average value (case A) and 10% deviation from the average value (case B)
(Tables 1 and 2).
Parameters used for calculating the increment in volume strains were assumed to
be correlated. For the purpose of calculations, the matrix of random variable correlation coefficients ρ αα = 1, ρ 23 = ρ 32 = 0.5, ρ 45 = ρ 54 = 0.5 (other values are zero)
has been arbitrarily adopted. The Monte Carlo method for N = 500 randomly selected
numbers was used in calculations. As a result of the calculations, the processes of
changes in the equivalent volume and the effective volume of corrosion products
were obtained, respectively for cases A and B considered in the work Figs. 3 and
4, and the sample load program for volume strain increments, Fig. 5. Total value of
volume strains calculated in accordance with Eq. (5) was calculated in 10 consecutive
time increments for calculation reasons. The concrete sample loading program with
the mentioned increases was presented for the lower in f
ε
V
and upper sup
ε
V
curves, respectively, limiting the allowable increments in the volume of corrosion
products.