

56
D. Tomaszewicz et al.
results obtained in the experimental tests. The results from lab tests are taken as the
reference.
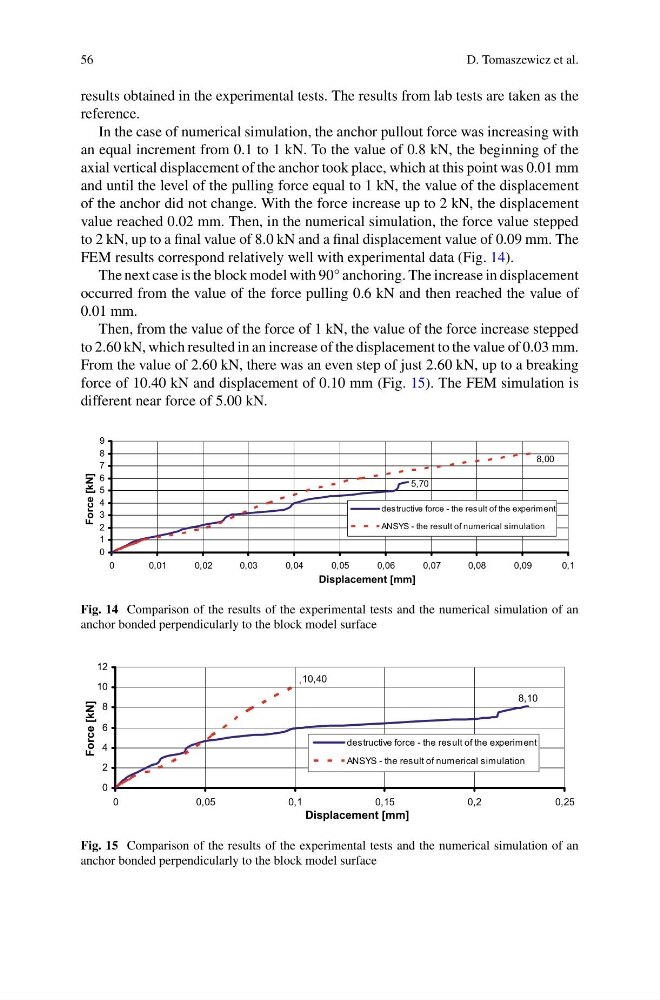
In the case of numerical simulation, the anchor pullout force was increasing with
an equal increment from 0.1 to 1 kN. To the value of 0.8 kN, the beginning of the
axial vertical displacement of the anchor took place, which at this point was 0.01 mm
and until the level of the pulling force equal to 1 kN, the value of the displacement
of the anchor did not change. With the force increase up to 2 kN, the displacement
value reached 0.02 mm. Then, in the numerical simulation, the force value stepped
to 2 kN, up to a final value of 8.0 kN and a final displacement value of 0.09 mm. The
FEM results correspond relatively well with experimental data (Fig. 14).
The next case is the block model with 90° anchoring. The increase in displacement
occurred from the value of the force pulling 0.6 kN and then reached the value of
0.01 mm.
Then, from the value of the force of 1 kN, the value of the force increase stepped
to 2.60 kN, which resulted in an increase of the displacement to the value of 0.03 mm.
From the value of 2.60 kN, there was an even step of just 2.60 kN, up to a breaking
force of 10.40 kN and displacement of 0.10 mm (Fig. 15). The FEM simulation is
different near force of 5.00 kN.
5,70
8,00
0
1
2
3
4
5
6
7
8
9
0
0,01
0,02
0,03
0,04
0,05
0,06
0,07
0,08
0,09
0,1
Displacement [mm]
Force [kN]
destructive force - the result of the experiment
ANSYS - the result of numerical simulation
Fig. 14 Comparison of the results of the experimental tests and the numerical simulation of an
anchor bonded perpendicularly to the block model surface
8,10
10,40
0
2
4
6
8
10
12
0
0,05
0,1
0,15
0,2
0,25
Displacement [mm]
Force [kN]
destructive force - the result of the experiment
ANSYS - the result of numerical simulation
Fig. 15 Comparison of the results of the experimental tests and the numerical simulation of an
anchor bonded perpendicularly to the block model surface
D. Tomaszewicz et al.
results obtained in the experimental tests. The results from lab tests are taken as the
reference.
In the case of numerical simulation, the anchor pullout force was increasing with
an equal increment from 0.1 to 1 kN. To the value of 0.8 kN, the beginning of the
axial vertical displacement of the anchor took place, which at this point was 0.01 mm
and until the level of the pulling force equal to 1 kN, the value of the displacement
of the anchor did not change. With the force increase up to 2 kN, the displacement
value reached 0.02 mm. Then, in the numerical simulation, the force value stepped
to 2 kN, up to a final value of 8.0 kN and a final displacement value of 0.09 mm. The
FEM results correspond relatively well with experimental data (Fig. 14).
The next case is the block model with 90° anchoring. The increase in displacement
occurred from the value of the force pulling 0.6 kN and then reached the value of
0.01 mm.
Then, from the value of the force of 1 kN, the value of the force increase stepped
to 2.60 kN, which resulted in an increase of the displacement to the value of 0.03 mm.
From the value of 2.60 kN, there was an even step of just 2.60 kN, up to a breaking
force of 10.40 kN and displacement of 0.10 mm (Fig. 15). The FEM simulation is
different near force of 5.00 kN.
5,70
8,00
0
1
2
3
4
5
6
7
8
9
0
0,01
0,02
0,03
0,04
0,05
0,06
0,07
0,08
0,09
0,1
Displacement [mm]
Force [kN]
destructive force - the result of the experiment
ANSYS - the result of numerical simulation
Fig. 14 Comparison of the results of the experimental tests and the numerical simulation of an
anchor bonded perpendicularly to the block model surface
8,10
10,40
0
2
4
6
8
10
12
0
0,05
0,1
0,15
0,2
0,25
Displacement [mm]
Force [kN]
destructive force - the result of the experiment
ANSYS - the result of numerical simulation
Fig. 15 Comparison of the results of the experimental tests and the numerical simulation of an
anchor bonded perpendicularly to the block model surface