

Delayed Building Schedule Control Using Milestones
199
Fig. 2 Schedule of works progress until the first stage of registration: period 01.10.2015–
16.11.2015 (activities: green—actual execution, yellow—planned execution, red—costs incurred).
Description in the text. Source Own study based on calculations of the Planista Max computer
program [12]
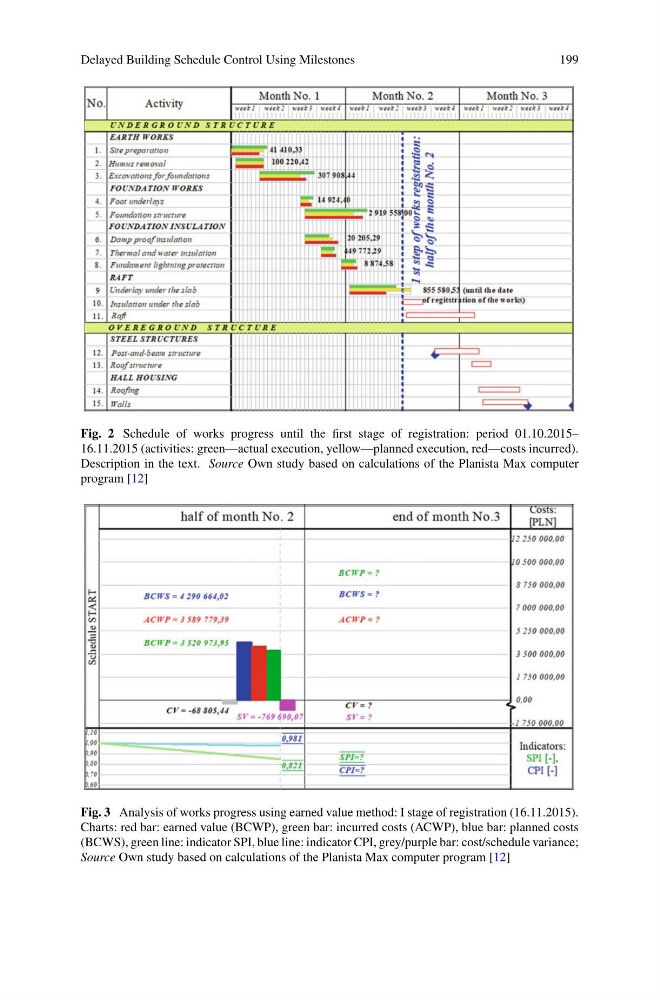
Fig. 3 Analysis of works progress using earned value method: I stage of registration (16.11.2015).
Charts: red bar: earned value (BCWP), green bar: incurred costs (ACWP), blue bar: planned costs
(BCWS), green line: indicator SPI, blue line: indicator CPI, grey/purple bar: cost/schedule variance;
Source Own study based on calculations of the Planista Max computer program [12]
199
Fig. 2 Schedule of works progress until the first stage of registration: period 01.10.2015–
16.11.2015 (activities: green—actual execution, yellow—planned execution, red—costs incurred).
Description in the text. Source Own study based on calculations of the Planista Max computer
program [12]
Fig. 3 Analysis of works progress using earned value method: I stage of registration (16.11.2015).
Charts: red bar: earned value (BCWP), green bar: incurred costs (ACWP), blue bar: planned costs
(BCWS), green line: indicator SPI, blue line: indicator CPI, grey/purple bar: cost/schedule variance;
Source Own study based on calculations of the Planista Max computer program [12]