

146
A. Kaleta-Jurowska et al.
testing. The shear rate was increased and decreased in a range from 0 to 150 s
−1 in
6 min. The results of the tests were presented as a flow curves. The measurements
were performed at temperatures of 20.0 ± 0.1 °C, after 10, 30 and 60 min. Yield
stress and plastic viscosity was calculated using the Bingham model. The area of
the hysteresis loop of flow curves was calculated using a numerical integral method
(trapezoidal rule).
4 Results of Testing and Their Analysis
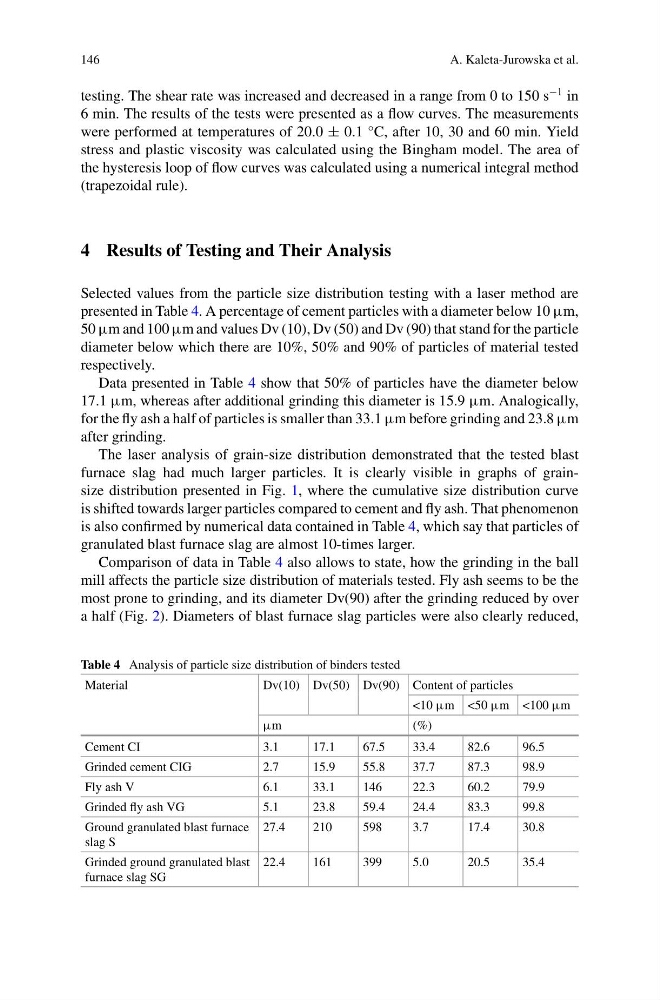
Selected values from the particle size distribution testing with a laser method are
presented in Table 4. A percentage of cement particles with a diameter below 10 µm,
50 µm and 100 µm and values Dv (10), Dv (50) and Dv (90) that stand for the particle
diameter below which there are 10%, 50% and 90% of particles of material tested
respectively.
Data presented in Table 4 show that 50% of particles have the diameter below
17.1 µm, whereas after additional grinding this diameter is 15.9 µm. Analogically,
for the fly ash a half of particles is smaller than 33.1 µm before grinding and 23.8 µm
after grinding.
The laser analysis of grain-size distribution demonstrated that the tested blast
furnace slag had much larger particles. It is clearly visible in graphs of grainsize distribution presented in Fig. 1, where the cumulative size distribution curve
is shifted towards larger particles compared to cement and fly ash. That phenomenon
is also confirmed by numerical data contained in Table 4, which say that particles of
granulated blast furnace slag are almost 10-times larger.
Comparison of data in Table 4 also allows to state, how the grinding in the ball
mill affects the particle size distribution of materials tested. Fly ash seems to be the
most prone to grinding, and its diameter Dv(90) after the grinding reduced by over
a half (Fig. 2). Diameters of blast furnace slag particles were also clearly reduced,
Table 4 Analysis of particle size distribution of binders tested
Material
Dv(10) Dv(50) Dv(90) Content of particles
<10 µm <50 µm <100 µm
µm
(%)
Cement CI
3.1
17.1
67.5
33.4
82.6
96.5
Grinded cement CIG
2.7
15.9
55.8
37.7
87.3
98.9
Fly ash V
6.1
33.1
146
22.3
60.2
79.9
Grinded fly ash VG
5.1
23.8
59.4
24.4
83.3
99.8
Ground granulated blast furnace
slag S
27.4
210
598
3.7
17.4
30.8
Grinded ground granulated blast
furnace slag SG
22.4
161
399
5.0
20.5
35.4
A. Kaleta-Jurowska et al.
testing. The shear rate was increased and decreased in a range from 0 to 150 s
−1 in
6 min. The results of the tests were presented as a flow curves. The measurements
were performed at temperatures of 20.0 ± 0.1 °C, after 10, 30 and 60 min. Yield
stress and plastic viscosity was calculated using the Bingham model. The area of
the hysteresis loop of flow curves was calculated using a numerical integral method
(trapezoidal rule).
4 Results of Testing and Their Analysis
Selected values from the particle size distribution testing with a laser method are
presented in Table 4. A percentage of cement particles with a diameter below 10 µm,
50 µm and 100 µm and values Dv (10), Dv (50) and Dv (90) that stand for the particle
diameter below which there are 10%, 50% and 90% of particles of material tested
respectively.
Data presented in Table 4 show that 50% of particles have the diameter below
17.1 µm, whereas after additional grinding this diameter is 15.9 µm. Analogically,
for the fly ash a half of particles is smaller than 33.1 µm before grinding and 23.8 µm
after grinding.
The laser analysis of grain-size distribution demonstrated that the tested blast
furnace slag had much larger particles. It is clearly visible in graphs of grainsize distribution presented in Fig. 1, where the cumulative size distribution curve
is shifted towards larger particles compared to cement and fly ash. That phenomenon
is also confirmed by numerical data contained in Table 4, which say that particles of
granulated blast furnace slag are almost 10-times larger.
Comparison of data in Table 4 also allows to state, how the grinding in the ball
mill affects the particle size distribution of materials tested. Fly ash seems to be the
most prone to grinding, and its diameter Dv(90) after the grinding reduced by over
a half (Fig. 2). Diameters of blast furnace slag particles were also clearly reduced,
Table 4 Analysis of particle size distribution of binders tested
Material
Dv(10) Dv(50) Dv(90) Content of particles
<10 µm <50 µm <100 µm
µm
(%)
Cement CI
3.1
17.1
67.5
33.4
82.6
96.5
Grinded cement CIG
2.7
15.9
55.8
37.7
87.3
98.9
Fly ash V
6.1
33.1
146
22.3
60.2
79.9
Grinded fly ash VG
5.1
23.8
59.4
24.4
83.3
99.8
Ground granulated blast furnace
slag S
27.4
210
598
3.7
17.4
30.8
Grinded ground granulated blast
furnace slag SG
22.4
161
399
5.0
20.5
35.4