

424
Practical MATLAB
® Applications for Engineers
ANALYTICAL Solution
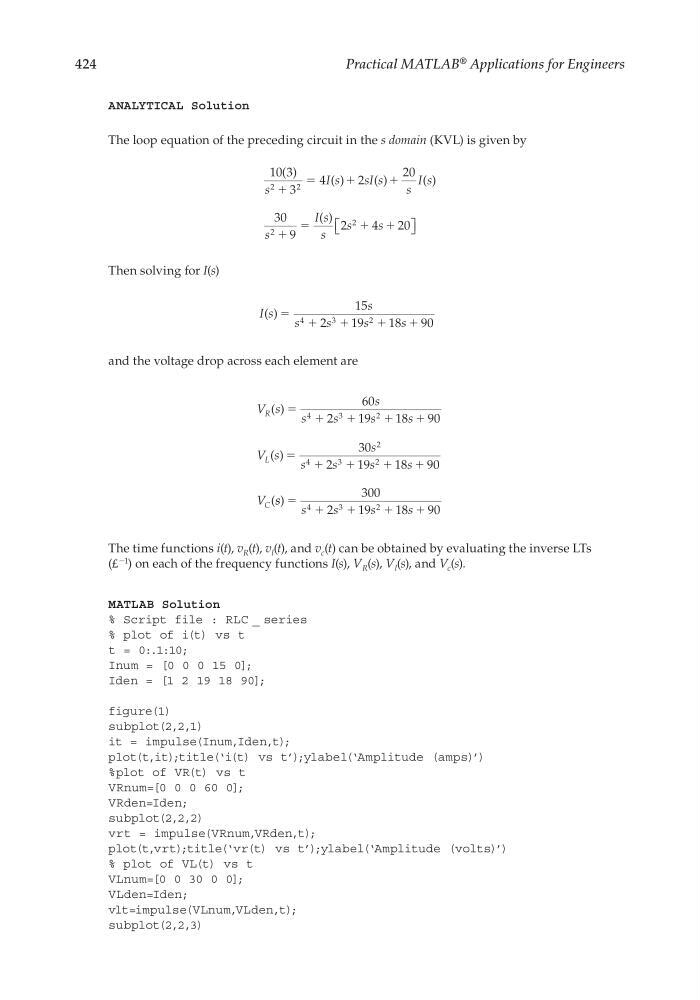
The loop equation of the preceding circuit in the s domain (KVL) is given by
10 3
3
4
2
20
30
9
2
4
20
2
2
2
2
( )
( )
( )
( )
( )
s
I s
sI s
s
I s
s
I s
s
s
s
ϩ
ϭ
ϩ
ϩ
ϩ
ϭ
ϩ ϩ
Then solving for I(s)
I s
s
s
s
s
s
( ) ϭ ϩ
ϩ
ϩ
ϩ
15
2
19
18
90
4
3
2
and the voltage drop across each element are
V s
s
s
s
s
s
V s
s
s
s
s
s
V
R
L
C
( )
( )
(
ϭ ϩ
ϩ
ϩ
ϩ
ϭ ϩ
ϩ
ϩ
ϩ
60
2
19
18
90
30
2
19
18
90
4
3
2
2
4
3
2
s s
s
s
s
s
) ϭ ϩ
ϩ
ϩ
ϩ
300
2
19
18
90
4
3
2
The time functions i(t), v R (t), v l (t), and v c (t) can be obtained by evaluating the inverse LTs
(£
−1
) on each of the frequency functions I(s), V R (s), V l (s), and V c (s).
MATLAB Solution
% Script file : RLC _ series
% plot of i(t) vs t
t = 0:.1:10;
Inum = [0 0 0 15 0];
Iden = [1 2 19 18 90];
figure(1)
subplot(2,2,1)
it = impulse(Inum,Iden,t);
plot(t,it);title(‘i(t) vs t’);ylabel(‘Amplitude (amps)’)
%plot of VR(t) vs t
VRnum=[0 0 0 60 0];
VRden=Iden;
subplot(2,2,2)
vrt = impulse(VRnum,VRden,t);
plot(t,vrt);title(‘vr(t) vs t’);ylabel(‘Amplitude (volts)’)
% plot of VL(t) vs t
VLnum=[0 0 30 0 0];
VLden=Iden;
vlt=impulse(VLnum,VLden,t);
subplot(2,2,3)
CRC_47760_CH004.indd 424
CRC_47760_CH004.indd 424
7/28/2008 12:26:17 PM
7/28/2008 12:26:17 PM
Practical MATLAB
® Applications for Engineers
ANALYTICAL Solution
The loop equation of the preceding circuit in the s domain (KVL) is given by
10 3
3
4
2
20
30
9
2
4
20
2
2
2
2
( )
( )
( )
( )
( )
s
I s
sI s
s
I s
s
I s
s
s
s
ϩ
ϭ
ϩ
ϩ
ϩ
ϭ
ϩ ϩ
Then solving for I(s)
I s
s
s
s
s
s
( ) ϭ ϩ
ϩ
ϩ
ϩ
15
2
19
18
90
4
3
2
and the voltage drop across each element are
V s
s
s
s
s
s
V s
s
s
s
s
s
V
R
L
C
( )
( )
(
ϭ ϩ
ϩ
ϩ
ϩ
ϭ ϩ
ϩ
ϩ
ϩ
60
2
19
18
90
30
2
19
18
90
4
3
2
2
4
3
2
s s
s
s
s
s
) ϭ ϩ
ϩ
ϩ
ϩ
300
2
19
18
90
4
3
2
The time functions i(t), v R (t), v l (t), and v c (t) can be obtained by evaluating the inverse LTs
(£
−1
) on each of the frequency functions I(s), V R (s), V l (s), and V c (s).
MATLAB Solution
% Script file : RLC _ series
% plot of i(t) vs t
t = 0:.1:10;
Inum = [0 0 0 15 0];
Iden = [1 2 19 18 90];
figure(1)
subplot(2,2,1)
it = impulse(Inum,Iden,t);
plot(t,it);title(‘i(t) vs t’);ylabel(‘Amplitude (amps)’)
%plot of VR(t) vs t
VRnum=[0 0 0 60 0];
VRden=Iden;
subplot(2,2,2)
vrt = impulse(VRnum,VRden,t);
plot(t,vrt);title(‘vr(t) vs t’);ylabel(‘Amplitude (volts)’)
% plot of VL(t) vs t
VLnum=[0 0 30 0 0];
VLden=Iden;
vlt=impulse(VLnum,VLden,t);
subplot(2,2,3)
CRC_47760_CH004.indd 424
CRC_47760_CH004.indd 424
7/28/2008 12:26:17 PM
7/28/2008 12:26:17 PM