

Fourier and Laplace
425
0
0
2
4
−4
−10
−20
−2
5
1 0
0
20
10
10
0
−10
−20
20
10
0
0
5
0
5
10
−10
−5
5
10
Amplitude (amps)
Amplitude (volts)
Amplitude (volts)
Amplitude (volts)
time (sec)
10
0
5
time (sec)
v l (t) versus t
v c (t) versus t
v r (t) versus t
i(t) versus t
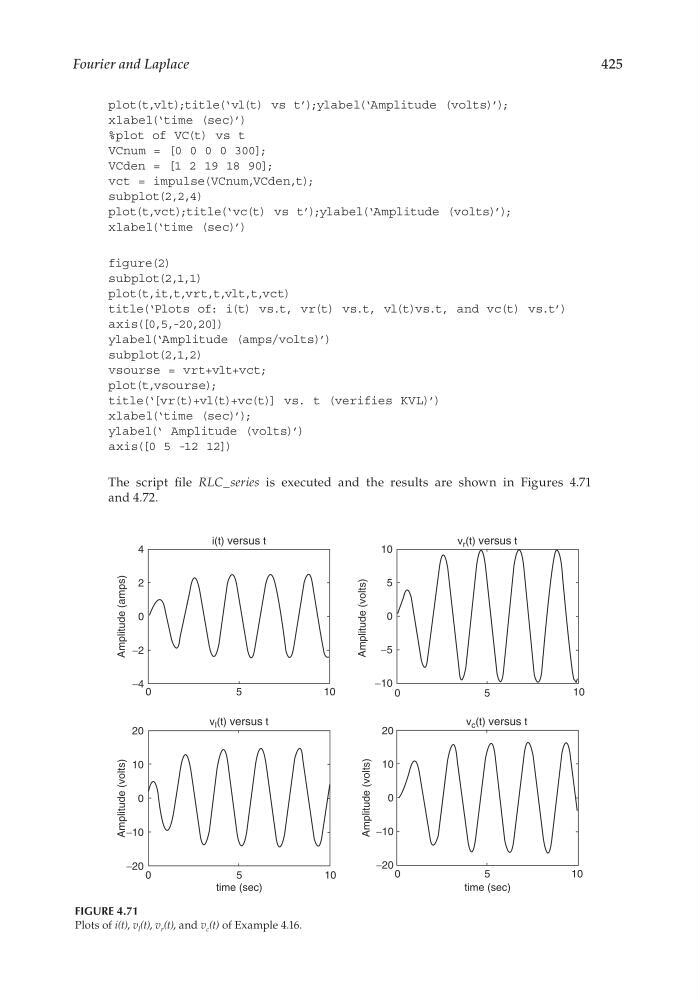
FIGURE 4.71
Plots of i(t), v l (t), v r (t), and v c (t) of Example 4.16.
plot(t,vlt);title(‘vl(t) vs t’);ylabel(‘Amplitude (volts)’);
xlabel(‘time (sec)’)
%plot of VC(t) vs t
VCnum = [0 0 0 0 300];
VCden = [1 2 19 18 90];
vct = impulse(VCnum,VCden,t);
subplot(2,2,4)
plot(t,vct);title(‘vc(t) vs t’);ylabel(‘Amplitude (volts)’);
xlabel(‘time (sec)’)
figure(2)
subplot(2,1,1)
plot(t,it,t,vrt,t,vlt,t,vct)
title(‘Plots of: i(t) vs.t, vr(t) vs.t, vl(t)vs.t, and vc(t) vs.t’)
axis([0,5,-20,20])
ylabel(‘Amplitude (amps/volts)’)
subplot(2,1,2)
vsourse = vrt+vlt+vct;
plot(t,vsourse);
title(‘[vr(t)+vl(t)+vc(t)] vs. t (verifies KVL)’)
xlabel(‘time (sec)’);
ylabel(‘ Amplitude (volts)’)
axis([0 5 -12 12])
The script fi le RLC_series is executed and the results are shown in Figures 4.71
and 4.72.
CRC_47760_CH004.indd 425
CRC_47760_CH004.indd 425
7/28/2008 12:26:18 PM
7/28/2008 12:26:18 PM
425
0
0
2
4
−4
−10
−20
−2
5
1 0
0
20
10
10
0
−10
−20
20
10
0
0
5
0
5
10
−10
−5
5
10
Amplitude (amps)
Amplitude (volts)
Amplitude (volts)
Amplitude (volts)
time (sec)
10
0
5
time (sec)
v l (t) versus t
v c (t) versus t
v r (t) versus t
i(t) versus t
FIGURE 4.71
Plots of i(t), v l (t), v r (t), and v c (t) of Example 4.16.
plot(t,vlt);title(‘vl(t) vs t’);ylabel(‘Amplitude (volts)’);
xlabel(‘time (sec)’)
%plot of VC(t) vs t
VCnum = [0 0 0 0 300];
VCden = [1 2 19 18 90];
vct = impulse(VCnum,VCden,t);
subplot(2,2,4)
plot(t,vct);title(‘vc(t) vs t’);ylabel(‘Amplitude (volts)’);
xlabel(‘time (sec)’)
figure(2)
subplot(2,1,1)
plot(t,it,t,vrt,t,vlt,t,vct)
title(‘Plots of: i(t) vs.t, vr(t) vs.t, vl(t)vs.t, and vc(t) vs.t’)
axis([0,5,-20,20])
ylabel(‘Amplitude (amps/volts)’)
subplot(2,1,2)
vsourse = vrt+vlt+vct;
plot(t,vsourse);
title(‘[vr(t)+vl(t)+vc(t)] vs. t (verifies KVL)’)
xlabel(‘time (sec)’);
ylabel(‘ Amplitude (volts)’)
axis([0 5 -12 12])
The script fi le RLC_series is executed and the results are shown in Figures 4.71
and 4.72.
CRC_47760_CH004.indd 425
CRC_47760_CH004.indd 425
7/28/2008 12:26:18 PM
7/28/2008 12:26:18 PM