

164
Practical MATLAB
® Applications for Engineers
>> Vmax = v(40)
Vmax =
32.9680
>> for k=41:200
t(k)=k/20; % 2 < t < 10
v(k)=Vmax*exp(-(t(k)-t(40))/tau2);
t(40)=40/20=2sec=t1
i(k)= -v(k)/(R2+R3);
end
>>
% plot the Voltage VC(t)
>> subplot(2,1,1)
>> plot(t,v)
>> axis([0 10 0 40]);
>> title (‘Transients in the circuit of Fig 2.62’)
>> xlabel(‘time in sec’), ylabel(‘Voltage vc(t)’)
>> grid on
>>
% plot the current IC (t)
>> subplot(2,1,2)
>> plot(t,i)
>> axis([0 10 -13 15]);
>> xlabel(‘time in sec’),ylabel(‘Current ic(t)’)
>> grid on
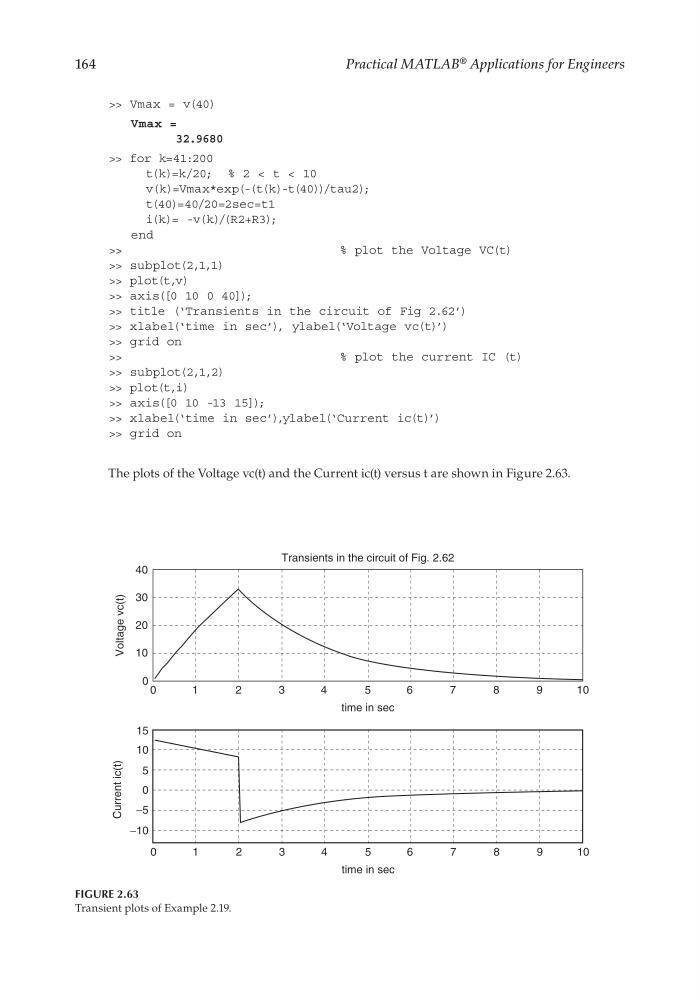
The plots of the Voltage vc(t) and the Current ic(t) versus t are shown in Figure 2.63.
FIGURE 2.63
Transient plots of Example 2.19.
40
30
20
10
0
0
1
2
3
4
5
time in sec
6
7
8
9
1 0
0
−10
−5
0
Current ic(t)
Voltage vc(t)
5
10
15
1
2
3
4
5
time in sec
6
7
8
9
1 0
Transients in the circuit of Fig. 2.62
CRC_47760_CH002.indd 164
CRC_47760_CH002.indd 164
7/23/2008 1:38:52 PM
7/23/2008 1:38:52 PM
Practical MATLAB
® Applications for Engineers
>> Vmax = v(40)
Vmax =
32.9680
>> for k=41:200
t(k)=k/20; % 2 < t < 10
v(k)=Vmax*exp(-(t(k)-t(40))/tau2);
t(40)=40/20=2sec=t1
i(k)= -v(k)/(R2+R3);
end
>>
% plot the Voltage VC(t)
>> subplot(2,1,1)
>> plot(t,v)
>> axis([0 10 0 40]);
>> title (‘Transients in the circuit of Fig 2.62’)
>> xlabel(‘time in sec’), ylabel(‘Voltage vc(t)’)
>> grid on
>>
% plot the current IC (t)
>> subplot(2,1,2)
>> plot(t,i)
>> axis([0 10 -13 15]);
>> xlabel(‘time in sec’),ylabel(‘Current ic(t)’)
>> grid on
The plots of the Voltage vc(t) and the Current ic(t) versus t are shown in Figure 2.63.
FIGURE 2.63
Transient plots of Example 2.19.
40
30
20
10
0
0
1
2
3
4
5
time in sec
6
7
8
9
1 0
0
−10
−5
0
Current ic(t)
Voltage vc(t)
5
10
15
1
2
3
4
5
time in sec
6
7
8
9
1 0
Transients in the circuit of Fig. 2.62
CRC_47760_CH002.indd 164
CRC_47760_CH002.indd 164
7/23/2008 1:38:52 PM
7/23/2008 1:38:52 PM