

Direct Current and Transient Analysis
153
>> plot (RL, IL)
>> grid on
>> xlabel(‘Load Resistance RL’), ylabel(‘Current IL’)
>> title(‘IL vs. RL’);
>> subplot(2,2,2)
>> plot(RL,VL)
>> grid on
>> xlabel(‘Load Resistance RL’), ylabel(‘Voltage VL’)
>> title(‘VL vs. RL’);
>> subplot(2,2,3)
>> P = IL.*VL;
>> plot(RL,P)
>> grid on
>> xlabel(‘Load Resistance RL’), ylabel(‘Power of RL’)
>> title(‘Power vs. RL’);
>> subplot(2,2,4)
>> plot(RL,IL,’o’,RL,VL,’+’,RL,P,’*’)
>> grid on
>> xlabel(‘Load Resistance RL’), ylabel(‘IL,VL,P=IL*VL’)
>> title(‘IL, VL, P vs. RL’);
>> legend(‘IL’,’VL’,’P’);
>> Imax = max(IL);
>> Vmax = max(VL);
>> Pmax = max(P);
>> Result = [Imax Vmax Pmax];
>> disp(‘
******* R E S U L T S *******”)
>> disp(‘************************************************’)
>> disp(‘The maximum values for IL, VL, and PL for 0
>> disp(‘
amps
volts
watts’)
>> disp(‘************************************************’)
**************************** R E S U L T S ********************
*****************************************************************
The maximum values for IL, VL, and PL for 0
6.6667
5.0000
amps
volts
watts
*****************************************************************
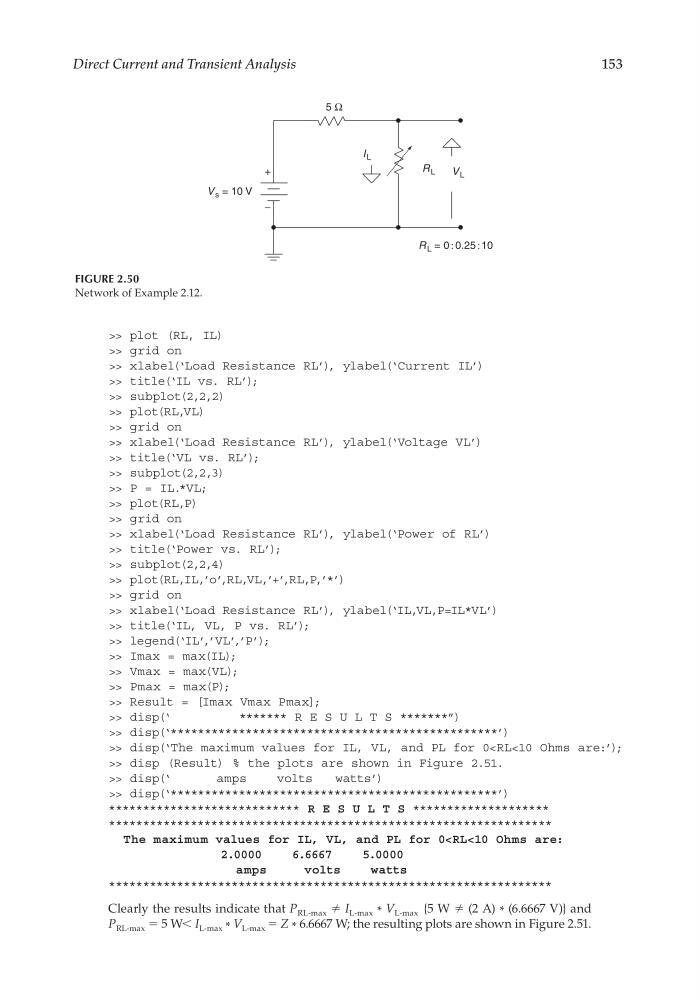
Clearly the results indicate that P RL-max ≠ I L-max * V L-max {5 W ≠ (2 A) * (6.6667 V)} and
P RL-max = 5 W< I L-max * V L-max = Z * 6.6667 W; the resulting plots are shown in Figure 2.51.
FIGURE 2.50
Network of Example 2.12.
R L
V s = 10 V
5 Ω
−
+
I L
V L
R L = 0 : 0.25 : 10
CRC_47760_CH002.indd 153
CRC_47760_CH002.indd 153
7/23/2008 1:38:49 PM
7/23/2008 1:38:49 PM
153
>> plot (RL, IL)
>> grid on
>> xlabel(‘Load Resistance RL’), ylabel(‘Current IL’)
>> title(‘IL vs. RL’);
>> subplot(2,2,2)
>> plot(RL,VL)
>> grid on
>> xlabel(‘Load Resistance RL’), ylabel(‘Voltage VL’)
>> title(‘VL vs. RL’);
>> subplot(2,2,3)
>> P = IL.*VL;
>> plot(RL,P)
>> grid on
>> xlabel(‘Load Resistance RL’), ylabel(‘Power of RL’)
>> title(‘Power vs. RL’);
>> subplot(2,2,4)
>> plot(RL,IL,’o’,RL,VL,’+’,RL,P,’*’)
>> grid on
>> xlabel(‘Load Resistance RL’), ylabel(‘IL,VL,P=IL*VL’)
>> title(‘IL, VL, P vs. RL’);
>> legend(‘IL’,’VL’,’P’);
>> Imax = max(IL);
>> Vmax = max(VL);
>> Pmax = max(P);
>> Result = [Imax Vmax Pmax];
>> disp(‘
******* R E S U L T S *******”)
>> disp(‘************************************************’)
>> disp(‘The maximum values for IL, VL, and PL for 0
>> disp(‘
amps
volts
watts’)
>> disp(‘************************************************’)
**************************** R E S U L T S ********************
*****************************************************************
The maximum values for IL, VL, and PL for 0
6.6667
5.0000
amps
volts
watts
*****************************************************************
Clearly the results indicate that P RL-max ≠ I L-max * V L-max {5 W ≠ (2 A) * (6.6667 V)} and
P RL-max = 5 W< I L-max * V L-max = Z * 6.6667 W; the resulting plots are shown in Figure 2.51.
FIGURE 2.50
Network of Example 2.12.
R L
V s = 10 V
5 Ω
−
+
I L
V L
R L = 0 : 0.25 : 10
CRC_47760_CH002.indd 153
CRC_47760_CH002.indd 153
7/23/2008 1:38:49 PM
7/23/2008 1:38:49 PM