

148
Practical MATLAB
® Applications for Engineers
Example 2.8
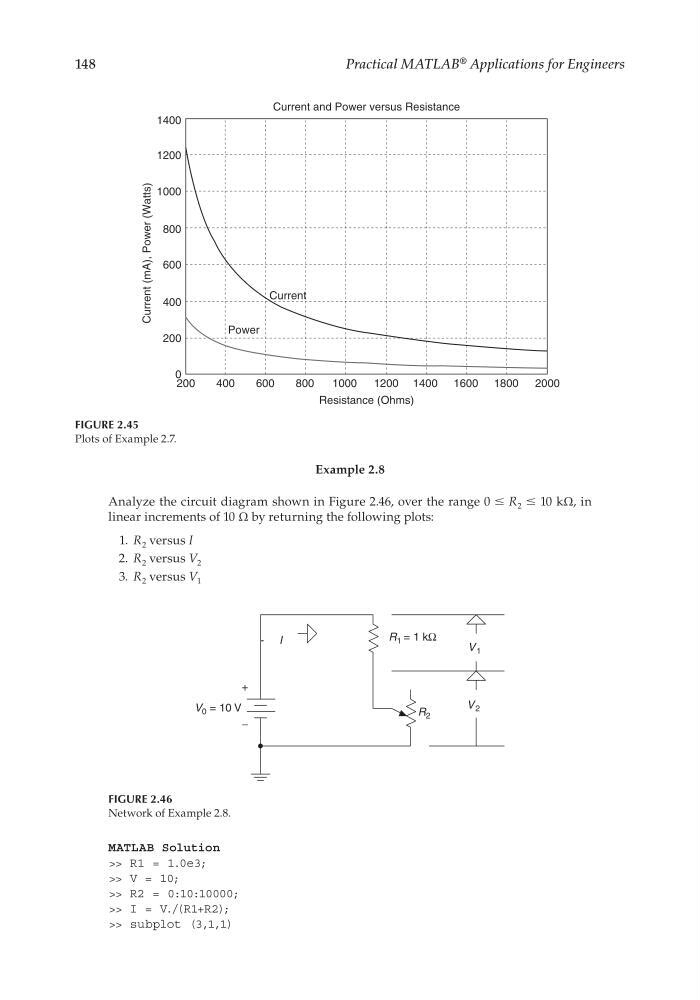
Analyze the circuit diagram shown in Figure 2.46, over the range 0 ≤ R 2 ≤ 10 kΩ, in
linear increments of 10 Ω by returning the following plots:
1. R 2 versus I
2. R 2 versus V 2
3. R 2 versus V 1
FIGURE 2.45
Plots of Example 2.7.
Current and Power versus Resistance
Current
Power
1400
1200
1000
800
Current (mA), Power (Watts)
600
400
200
200
400
600
800
1000
1200
Resistance (Ohms)
1400 1600 1800 2000
0
FIGURE 2.46
Network of Example 2.8.
R 1 = 1 kΩ
V 0 = 10 V
-
+
−
R 2
V 2
V 1
I
MATLAB Solution
>> R1 = 1.0e3;
>> V = 10;
>> R2 = 0:10:10000;
>> I = V./(R1+R2);
>> subplot (3,1,1)
CRC_47760_CH002.indd 148
CRC_47760_CH002.indd 148
7/23/2008 1:38:47 PM
7/23/2008 1:38:47 PM
Practical MATLAB
® Applications for Engineers
Example 2.8
Analyze the circuit diagram shown in Figure 2.46, over the range 0 ≤ R 2 ≤ 10 kΩ, in
linear increments of 10 Ω by returning the following plots:
1. R 2 versus I
2. R 2 versus V 2
3. R 2 versus V 1
FIGURE 2.45
Plots of Example 2.7.
Current and Power versus Resistance
Current
Power
1400
1200
1000
800
Current (mA), Power (Watts)
600
400
200
200
400
600
800
1000
1200
Resistance (Ohms)
1400 1600 1800 2000
0
FIGURE 2.46
Network of Example 2.8.
R 1 = 1 kΩ
V 0 = 10 V
-
+
−
R 2
V 2
V 1
I
MATLAB Solution
>> R1 = 1.0e3;
>> V = 10;
>> R2 = 0:10:10000;
>> I = V./(R1+R2);
>> subplot (3,1,1)
CRC_47760_CH002.indd 148
CRC_47760_CH002.indd 148
7/23/2008 1:38:47 PM
7/23/2008 1:38:47 PM