

Direct Current and Transient Analysis
147
Example 2.7
Analyze the circuit shown in Figure 2.43 for the case where the applied voltage source
is constant at V 0 = 250 V, but the resistance (R) varies over the range 200 Ω ≤ R ≤ 2 kΩ
in linear increments of 10 Ω. Obtain plots of
1. I versus R
2. P R versus R
MATLAB Solution
>> V = 250;
>> R = 200:10:2000;
>> I = V./R;
>> P = I.*V;
>> plot(R,I*1000,R,P)
% current in mA
>> title(‘Current and Power vs Resistance’)
>> xlabel(‘Resistance (Ohms)’), ylabel(‘Current (mA), Power(Watts)’)
>> grid on
>> gtext (‘Current’)
% place the text ‘Current’ and ‘Power’
>> gtext (‘Power’)
% control text by mouse
>> % plots are shown in Figure 2.45
Note that by increasing R, the current I decreases. Since P R = I
2 R, increasing R dec reases
I, where I is the dominant variable. Then by increasing R, the power P R decreases.
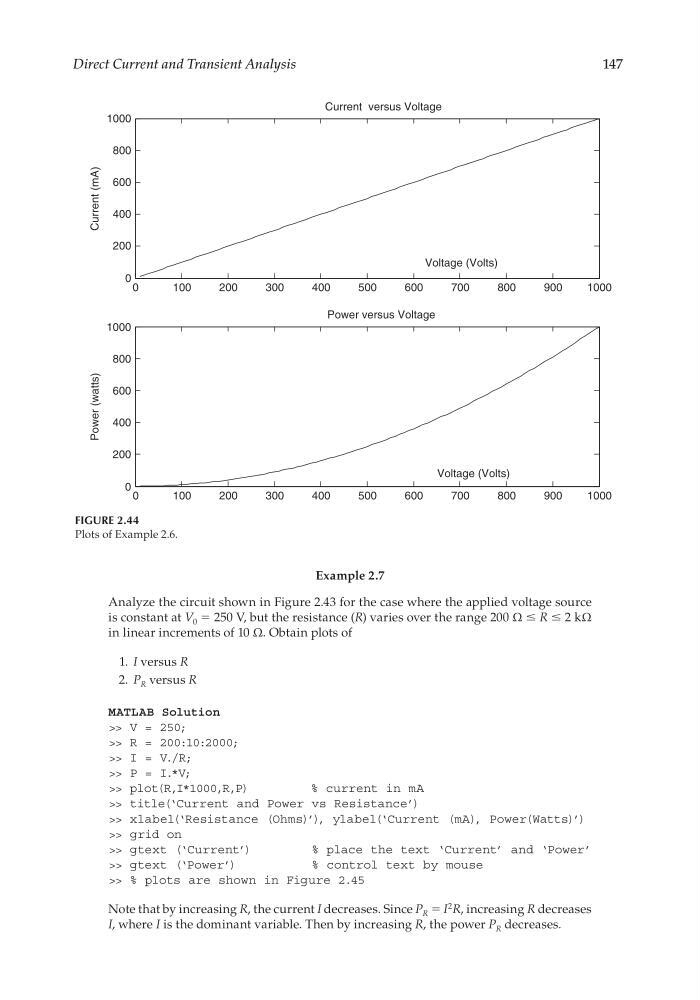
FIGURE 2.44
Plots of Example 2.6.
0
100
200
300
400
500
600
700
800
900
1000
0
100
200
300
400
500
600
700
800
900
1000
Current versus Voltage
Voltage (Volts)
Voltage (Volts)
0
200
400
600
800
1000
0
200
400
600
800
1000
Power versus Voltage
Power (watts)
Current (mA)
CRC_47760_CH002.indd 147
CRC_47760_CH002.indd 147
7/23/2008 1:38:47 PM
7/23/2008 1:38:47 PM
147
Example 2.7
Analyze the circuit shown in Figure 2.43 for the case where the applied voltage source
is constant at V 0 = 250 V, but the resistance (R) varies over the range 200 Ω ≤ R ≤ 2 kΩ
in linear increments of 10 Ω. Obtain plots of
1. I versus R
2. P R versus R
MATLAB Solution
>> V = 250;
>> R = 200:10:2000;
>> I = V./R;
>> P = I.*V;
>> plot(R,I*1000,R,P)
% current in mA
>> title(‘Current and Power vs Resistance’)
>> xlabel(‘Resistance (Ohms)’), ylabel(‘Current (mA), Power(Watts)’)
>> grid on
>> gtext (‘Current’)
% place the text ‘Current’ and ‘Power’
>> gtext (‘Power’)
% control text by mouse
>> % plots are shown in Figure 2.45
Note that by increasing R, the current I decreases. Since P R = I
2 R, increasing R dec reases
I, where I is the dominant variable. Then by increasing R, the power P R decreases.
FIGURE 2.44
Plots of Example 2.6.
0
100
200
300
400
500
600
700
800
900
1000
0
100
200
300
400
500
600
700
800
900
1000
Current versus Voltage
Voltage (Volts)
Voltage (Volts)
0
200
400
600
800
1000
0
200
400
600
800
1000
Power versus Voltage
Power (watts)
Current (mA)
CRC_47760_CH002.indd 147
CRC_47760_CH002.indd 147
7/23/2008 1:38:47 PM
7/23/2008 1:38:47 PM