

Direct Current and Transient Analysis
123
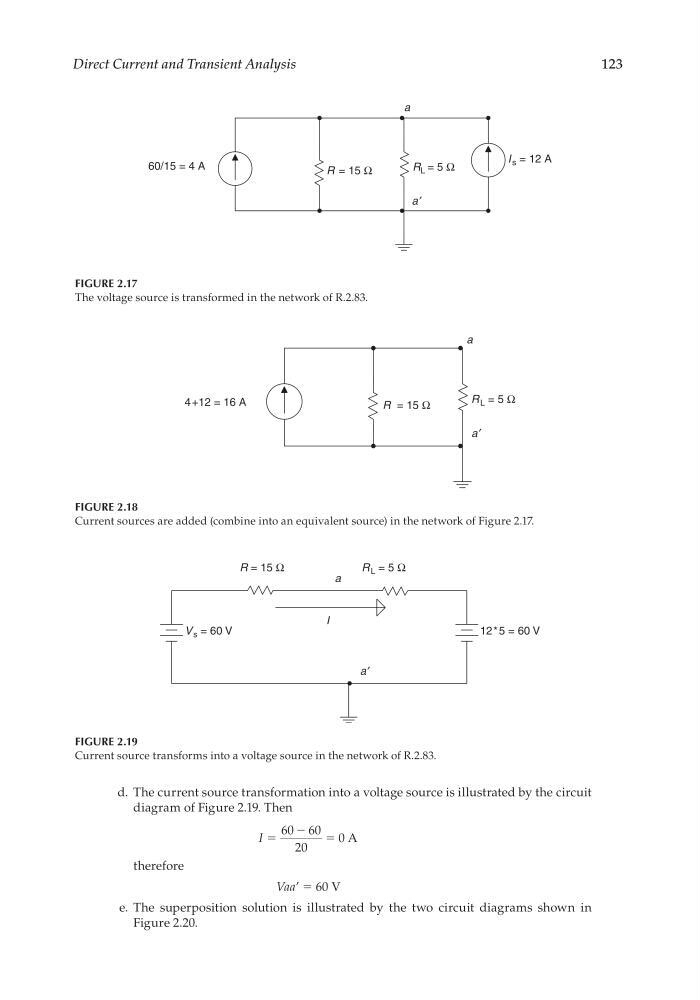
d. The current source transformation into a voltage source is illustrated by the circuit
diagram of Figure 2.19. Then
I ϭ
ϭ
60 60
20
0
Ϫ
A
therefore
Vaa’ = 60 V
e. The superposition solution is illustrated by the two circuit diagrams shown in
Figure 2.20.
FIGURE 2.17
The voltage source is transformed in the network of R.2.83.
a
R = 15 Ω
I s = 12 A
60/15 = 4 A
a ′
R L = 5 Ω
FIGURE 2.18
Current sources are added (combine into an equivalent source) in the network of Figure 2.17.
4 +12 = 16 A
R L = 5 Ω
R = 15 Ω
a ′
a
FIGURE 2.19
Current source transforms into a voltage source in the network of R.2.83.
a
a ′
V s = 60 V
12 * 5 = 60 V
I
R L = 5 Ω
R = 15 Ω
CRC_47760_CH002.indd 123
CRC_47760_CH002.indd 123
7/23/2008 1:38:40 PM
7/23/2008 1:38:40 PM
123
d. The current source transformation into a voltage source is illustrated by the circuit
diagram of Figure 2.19. Then
I ϭ
ϭ
60 60
20
0
Ϫ
A
therefore
Vaa’ = 60 V
e. The superposition solution is illustrated by the two circuit diagrams shown in
Figure 2.20.
FIGURE 2.17
The voltage source is transformed in the network of R.2.83.
a
R = 15 Ω
I s = 12 A
60/15 = 4 A
a ′
R L = 5 Ω
FIGURE 2.18
Current sources are added (combine into an equivalent source) in the network of Figure 2.17.
4 +12 = 16 A
R L = 5 Ω
R = 15 Ω
a ′
a
FIGURE 2.19
Current source transforms into a voltage source in the network of R.2.83.
a
a ′
V s = 60 V
12 * 5 = 60 V
I
R L = 5 Ω
R = 15 Ω
CRC_47760_CH002.indd 123
CRC_47760_CH002.indd 123
7/23/2008 1:38:40 PM
7/23/2008 1:38:40 PM