

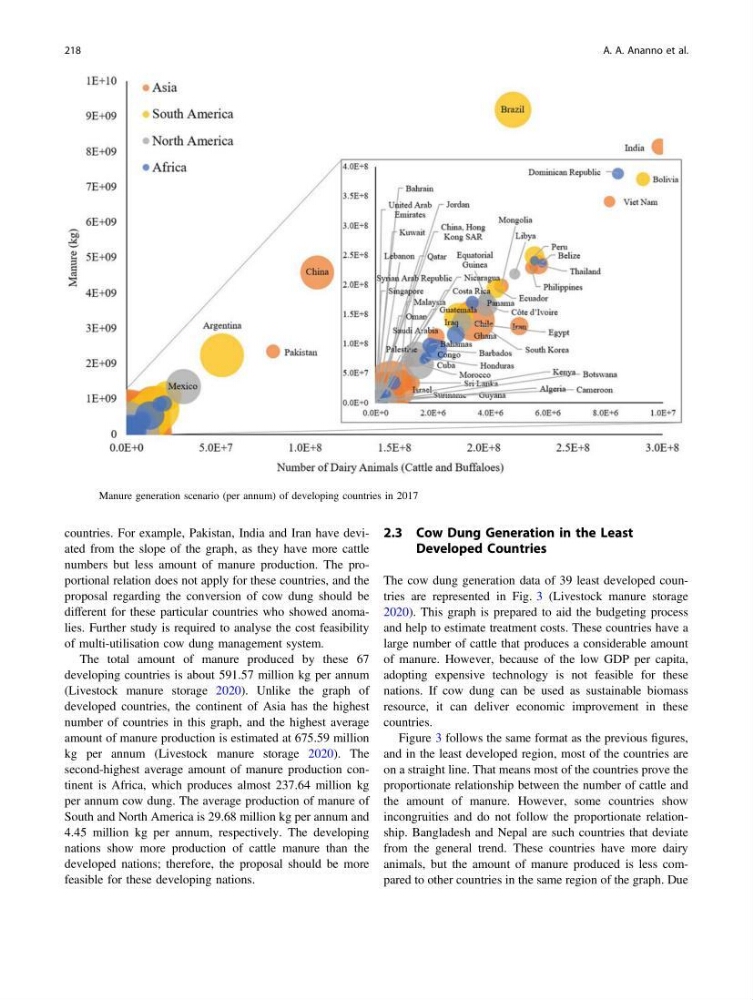
countries. For example, Pakistan, India and Iran have deviated from the slope of the graph, as they have more cattle
numbers but less amount of manure production. The proportional relation does not apply for these countries, and the
proposal regarding the conversion of cow dung should be
different for these particular countries who showed anomalies. Further study is required to analyse the cost feasibility
of multi-utilisation cow dung management system.
The total amount of manure produced by these 67
developing countries is about 591.57 million kg per annum
(Livestock manure storage 2020). Unlike the graph of
developed countries, the continent of Asia has the highest
number of countries in this graph, and the highest average
amount of manure production is estimated at 675.59 million
kg per annum (Livestock manure storage 2020). The
second-highest average amount of manure production continent is Africa, which produces almost 237.64 million kg
per annum cow dung. The average production of manure of
South and North America is 29.68 million kg per annum and
4.45 million kg per annum, respectively. The developing
nations show more production of cattle manure than the
developed nations; therefore, the proposal should be more
feasible for these developing nations.
2.3 Cow Dung Generation in the Least
Developed Countries
The cow dung generation data of 39 least developed countries are represented in Fig. 3 (Livestock manure storage
2020). This graph is prepared to aid the budgeting process
and help to estimate treatment costs. These countries have a
large number of cattle that produces a considerable amount
of manure. However, because of the low GDP per capita,
adopting expensive technology is not feasible for these
nations. If cow dung can be used as sustainable biomass
resource, it can deliver economic improvement in these
countries.
Figure 3 follows the same format as the previous figures,
and in the least developed region, most of the countries are
on a straight line. That means most of the countries prove the
proportionate relationship between the number of cattle and
the amount of manure. However, some countries show
incongruities and do not follow the proportionate relationship. Bangladesh and Nepal are such countries that deviate
from the general trend. These countries have more dairy
animals, but the amount of manure produced is less compared to other countries in the same region of the graph. Due
Fig. 2 Manure generation scenario (per annum) of developing countries in 2017
218
A. A. Ananno et al.
numbers but less amount of manure production. The proportional relation does not apply for these countries, and the
proposal regarding the conversion of cow dung should be
different for these particular countries who showed anomalies. Further study is required to analyse the cost feasibility
of multi-utilisation cow dung management system.
The total amount of manure produced by these 67
developing countries is about 591.57 million kg per annum
(Livestock manure storage 2020). Unlike the graph of
developed countries, the continent of Asia has the highest
number of countries in this graph, and the highest average
amount of manure production is estimated at 675.59 million
kg per annum (Livestock manure storage 2020). The
second-highest average amount of manure production continent is Africa, which produces almost 237.64 million kg
per annum cow dung. The average production of manure of
South and North America is 29.68 million kg per annum and
4.45 million kg per annum, respectively. The developing
nations show more production of cattle manure than the
developed nations; therefore, the proposal should be more
feasible for these developing nations.
2.3 Cow Dung Generation in the Least
Developed Countries
The cow dung generation data of 39 least developed countries are represented in Fig. 3 (Livestock manure storage
2020). This graph is prepared to aid the budgeting process
and help to estimate treatment costs. These countries have a
large number of cattle that produces a considerable amount
of manure. However, because of the low GDP per capita,
adopting expensive technology is not feasible for these
nations. If cow dung can be used as sustainable biomass
resource, it can deliver economic improvement in these
countries.
Figure 3 follows the same format as the previous figures,
and in the least developed region, most of the countries are
on a straight line. That means most of the countries prove the
proportionate relationship between the number of cattle and
the amount of manure. However, some countries show
incongruities and do not follow the proportionate relationship. Bangladesh and Nepal are such countries that deviate
from the general trend. These countries have more dairy
animals, but the amount of manure produced is less compared to other countries in the same region of the graph. Due
Fig. 2 Manure generation scenario (per annum) of developing countries in 2017
218
A. A. Ananno et al.