

experienced a higher thermophilic temperature (60–67 °C)
followed by maturing or curing phase after four weeks of
treatment. The pH of the co-composting piles was relatively
constant (pH 8.1–8.6) during the process while the humidity
was reduced from 64.5 to 52.0%.
Decanter cake (DC) generated during CPO purification is
about 4–5% of the FFB processed, contributing to the
overall solid waste produced that requires land space for
storage and disposal. Another problem occurs when DC is
dried, it becomes a fire hazard around the mill area
(Dewayanto et al. 2014). Co-composting of EFB and DC
slurry with POME addition showed promising potential for a
treatment strategy (Yahya et al. 2010). Decanter cake slurry
addition increased the rate of the co-composting process of
the EFB. After day-51, the C/N ratio for the matured
co-compost with the DC slurry was found to be 18.65 while
compost without DC slurry gave a higher ratio of 28.02 from
an initial C/N ratio of EFB at 63.67. The final product with
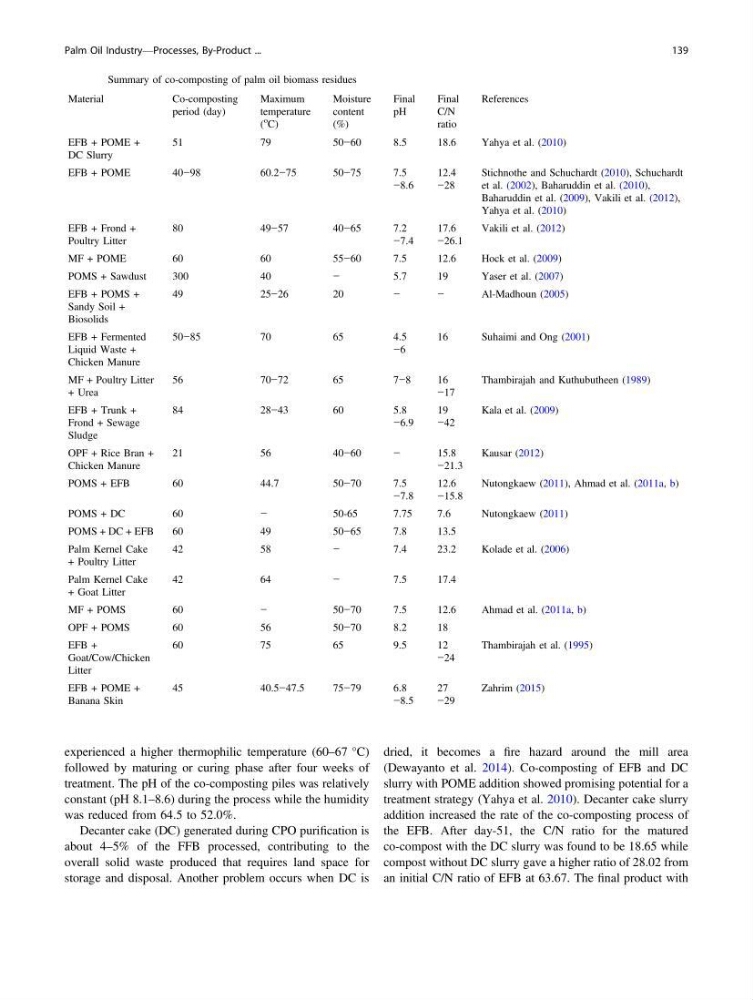
Table 6 Summary of co-composting of palm oil biomass residues
Material
Co-composting
period (day)
Maximum
temperature
(
o
C)
Moisture
content
(%)
Final
pH
Final
C/N
ratio
References
EFB + POME +
DC Slurry
51
79
50−60
8.5
18.6
Yahya et al. (2010)
EFB + POME
40−98
60.2−75
50−75
7.5
−8.6
12.4
−28
Stichnothe and Schuchardt (2010), Schuchardt
et al. (2002), Baharuddin et al. (2010),
Baharuddin et al. (2009), Vakili et al. (2012),
Yahya et al. (2010)
EFB + Frond +
Poultry Litter
80
49−57
40−65
7.2
−7.4
17.6
−26.1
Vakili et al. (2012)
MF + POME
60
60
55−60
7.5
12.6
Hock et al. (2009)
POMS + Sawdust
300
40
−
5.7
19
Yaser et al. (2007)
EFB + POMS +
Sandy Soil +
Biosolids
49
25−26
20
−
−
Al-Madhoun (2005)
EFB + Fermented
Liquid Waste +
Chicken Manure
50−85
70
65
4.5
−6
16
Suhaimi and Ong (2001)
MF + Poultry Litter
+ Urea
56
70−72
65
7−8
16
−17
Thambirajah and Kuthubutheen (1989)
EFB + Trunk +
Frond + Sewage
Sludge
84
28−43
60
5.8
−6.9
19
−42
Kala et al. (2009)
OPF + Rice Bran +
Chicken Manure
21
56
40−60
−
15.8
−21.3
Kausar (2012)
POMS + EFB
60
44.7
50−70
7.5
−7.8
12.6
−15.8
Nutongkaew (2011), Ahmad et al. (2011a, b)
POMS + DC
60
−
50-65
7.75
7.6
Nutongkaew (2011)
POMS + DC + EFB
60
49
50−65
7.8
13.5
Palm Kernel Cake
+ Poultry Litter
42
58
−
7.4
23.2
Kolade et al. (2006)
Palm Kernel Cake
+ Goat Litter
42
64
−
7.5
17.4
MF + POMS
60
−
50−70
7.5
12.6
Ahmad et al. (2011a, b)
OPF + POMS
60
56
50−70
8.2
18
EFB +
Goat/Cow/Chicken
Litter
60
75
65
9.5
12
−24
Thambirajah et al. (1995)
EFB + POME +
Banana Skin
45
40.5−47.5
75−79
6.8
−8.5
27
−29
Zahrim (2015)
Palm Oil Industry—Processes, By-Product ...
139
followed by maturing or curing phase after four weeks of
treatment. The pH of the co-composting piles was relatively
constant (pH 8.1–8.6) during the process while the humidity
was reduced from 64.5 to 52.0%.
Decanter cake (DC) generated during CPO purification is
about 4–5% of the FFB processed, contributing to the
overall solid waste produced that requires land space for
storage and disposal. Another problem occurs when DC is
dried, it becomes a fire hazard around the mill area
(Dewayanto et al. 2014). Co-composting of EFB and DC
slurry with POME addition showed promising potential for a
treatment strategy (Yahya et al. 2010). Decanter cake slurry
addition increased the rate of the co-composting process of
the EFB. After day-51, the C/N ratio for the matured
co-compost with the DC slurry was found to be 18.65 while
compost without DC slurry gave a higher ratio of 28.02 from
an initial C/N ratio of EFB at 63.67. The final product with
Table 6 Summary of co-composting of palm oil biomass residues
Material
Co-composting
period (day)
Maximum
temperature
(
o
C)
Moisture
content
(%)
Final
pH
Final
C/N
ratio
References
EFB + POME +
DC Slurry
51
79
50−60
8.5
18.6
Yahya et al. (2010)
EFB + POME
40−98
60.2−75
50−75
7.5
−8.6
12.4
−28
Stichnothe and Schuchardt (2010), Schuchardt
et al. (2002), Baharuddin et al. (2010),
Baharuddin et al. (2009), Vakili et al. (2012),
Yahya et al. (2010)
EFB + Frond +
Poultry Litter
80
49−57
40−65
7.2
−7.4
17.6
−26.1
Vakili et al. (2012)
MF + POME
60
60
55−60
7.5
12.6
Hock et al. (2009)
POMS + Sawdust
300
40
−
5.7
19
Yaser et al. (2007)
EFB + POMS +
Sandy Soil +
Biosolids
49
25−26
20
−
−
Al-Madhoun (2005)
EFB + Fermented
Liquid Waste +
Chicken Manure
50−85
70
65
4.5
−6
16
Suhaimi and Ong (2001)
MF + Poultry Litter
+ Urea
56
70−72
65
7−8
16
−17
Thambirajah and Kuthubutheen (1989)
EFB + Trunk +
Frond + Sewage
Sludge
84
28−43
60
5.8
−6.9
19
−42
Kala et al. (2009)
OPF + Rice Bran +
Chicken Manure
21
56
40−60
−
15.8
−21.3
Kausar (2012)
POMS + EFB
60
44.7
50−70
7.5
−7.8
12.6
−15.8
Nutongkaew (2011), Ahmad et al. (2011a, b)
POMS + DC
60
−
50-65
7.75
7.6
Nutongkaew (2011)
POMS + DC + EFB
60
49
50−65
7.8
13.5
Palm Kernel Cake
+ Poultry Litter
42
58
−
7.4
23.2
Kolade et al. (2006)
Palm Kernel Cake
+ Goat Litter
42
64
−
7.5
17.4
MF + POMS
60
−
50−70
7.5
12.6
Ahmad et al. (2011a, b)
OPF + POMS
60
56
50−70
8.2
18
EFB +
Goat/Cow/Chicken
Litter
60
75
65
9.5
12
−24
Thambirajah et al. (1995)
EFB + POME +
Banana Skin
45
40.5−47.5
75−79
6.8
−8.5
27
−29
Zahrim (2015)
Palm Oil Industry—Processes, By-Product ...
139