

78
4 Investigation into the Adsorption of Cadmium and Lead …
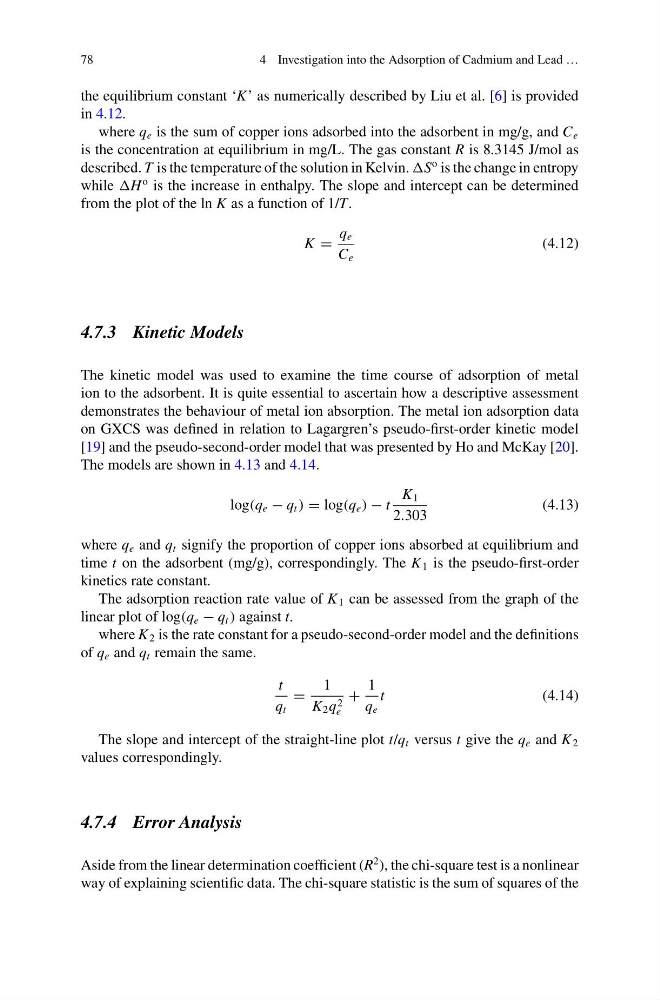
the equilibrium constant ‘K’ as numerically described by Liu et al. [6] is provided
in 4.12.
where q e is the sum of copper ions adsorbed into the adsorbent in mg/g, and C e
is the concentration at equilibrium in mg/L. The gas constant R is 8.3145 J/mol as
described. T is the temperature of the solution in Kelvin. S
o is the change in entropy
while H
o is the increase in enthalpy. The slope and intercept can be determined
from the plot of the ln K as a function of 1/T.
K =
q e
C e
(4.12)
4.7.3 Kinetic Models
The kinetic model was used to examine the time course of adsorption of metal
ion to the adsorbent. It is quite essential to ascertain how a descriptive assessment
demonstrates the behaviour of metal ion absorption. The metal ion adsorption data
on GXCS was defined in relation to Lagargren’s pseudo-first-order kinetic model
[19] and the pseudo-second-order model that was presented by Ho and McKay [20].
The models are shown in 4.13 and 4.14.
log(q e − q t ) = log(q e ) − t
K 1
2.303
(4.13)
where q e and q t signify the proportion of copper ions absorbed at equilibrium and
time t on the adsorbent (mg/g), correspondingly. The K 1 is the pseudo-first-order
kinetics rate constant.
The adsorption reaction rate value of K 1 can be assessed from the graph of the
linear plot of log(q e − q t ) against t.
where K 2 is the rate constant for a pseudo-second-order model and the definitions
of q e and q t remain the same.
t
q t
=
1
K 2 q 2
e
+
1
q e
t
(4.14)
The slope and intercept of the straight-line plot t/q t versus t give the q e and K 2
values correspondingly.
4.7.4 Error Analysis
Aside from the linear determination coefficient (R
2 ), the chi-square test is a nonlinear
way of explaining scientific data. The chi-square statistic is the sum of squares of the
4 Investigation into the Adsorption of Cadmium and Lead …
the equilibrium constant ‘K’ as numerically described by Liu et al. [6] is provided
in 4.12.
where q e is the sum of copper ions adsorbed into the adsorbent in mg/g, and C e
is the concentration at equilibrium in mg/L. The gas constant R is 8.3145 J/mol as
described. T is the temperature of the solution in Kelvin. S
o is the change in entropy
while H
o is the increase in enthalpy. The slope and intercept can be determined
from the plot of the ln K as a function of 1/T.
K =
q e
C e
(4.12)
4.7.3 Kinetic Models
The kinetic model was used to examine the time course of adsorption of metal
ion to the adsorbent. It is quite essential to ascertain how a descriptive assessment
demonstrates the behaviour of metal ion absorption. The metal ion adsorption data
on GXCS was defined in relation to Lagargren’s pseudo-first-order kinetic model
[19] and the pseudo-second-order model that was presented by Ho and McKay [20].
The models are shown in 4.13 and 4.14.
log(q e − q t ) = log(q e ) − t
K 1
2.303
(4.13)
where q e and q t signify the proportion of copper ions absorbed at equilibrium and
time t on the adsorbent (mg/g), correspondingly. The K 1 is the pseudo-first-order
kinetics rate constant.
The adsorption reaction rate value of K 1 can be assessed from the graph of the
linear plot of log(q e − q t ) against t.
where K 2 is the rate constant for a pseudo-second-order model and the definitions
of q e and q t remain the same.
t
q t
=
1
K 2 q 2
e
+
1
q e
t
(4.14)
The slope and intercept of the straight-line plot t/q t versus t give the q e and K 2
values correspondingly.
4.7.4 Error Analysis
Aside from the linear determination coefficient (R
2 ), the chi-square test is a nonlinear
way of explaining scientific data. The chi-square statistic is the sum of squares of the