

7.6 Outcome of Characterization
153
0
400
800
1200
1600
0.0
0.1
0.2
0.3
0.4
0.5
0
4000
8000
12000
0.0
0.5
1.0
1.5
2.0
2.5
0
400
800
1200
1600
0.0
0.1
0.2
0.3
0.4
0.5
0
400
800
1200
1600
0.0
0.1
0.2
0.3
0.4
0.5
0.6
0.7
0
400
800
1200
0.0
0.2
0.4
0.6
0.8
1.0
0
400
800
1200
1600
0.0
0.1
0.2
0.3
0.4
0.5
q
e
(mmol/g)
Time (min)
model
exp
q
e
(mmol/g)
Time (min)
model
exp
q
e
(mmol/g)
Time (min)
model
exp
q
e
(mmol/g)
Time (min)
model
exp
q
e
(mmol/g)
Time (min)
model
exp
Cu
2+
Pb
2+
Cd
2+
Ni
2+
Zn
2+
Cr
6+
q
e
(mmol/g)
Time (min)
model
exp
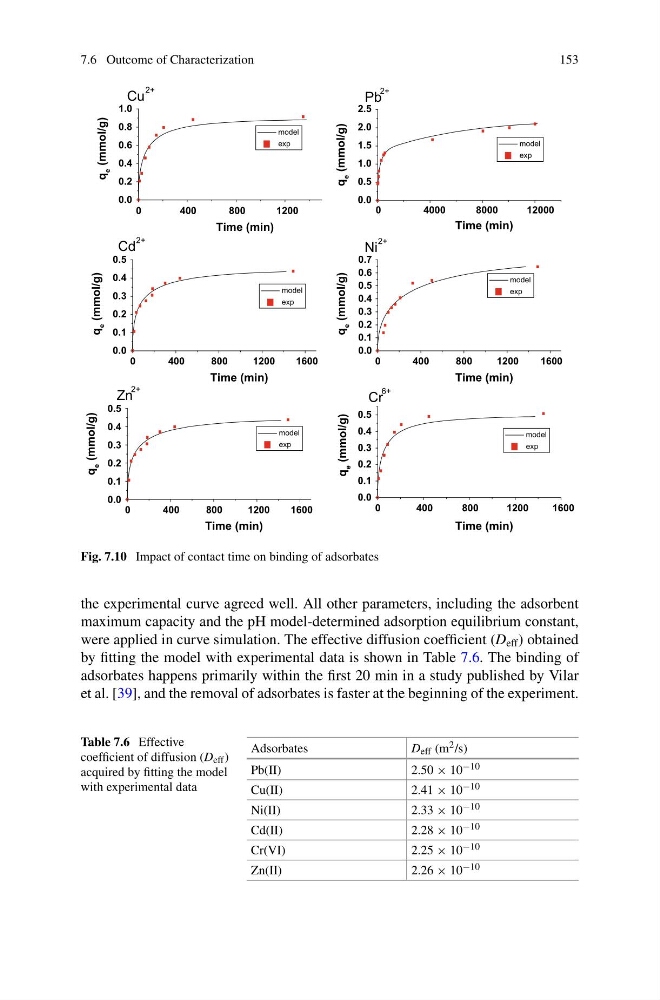
Fig. 7.10 Impact of contact time on binding of adsorbates
the experimental curve agreed well. All other parameters, including the adsorbent
maximum capacity and the pH model-determined adsorption equilibrium constant,
were applied in curve simulation. The effective diffusion coefficient (D eff ) obtained
by fitting the model with experimental data is shown in Table 7.6. The binding of
adsorbates happens primarily within the first 20 min in a study published by Vilar
et al. [39], and the removal of adsorbates is faster at the beginning of the experiment.
Table 7.6 Effective
coefficient of diffusion (D eff )
acquired by fitting the model
with experimental data
Adsorbates
D eff (m 2 /s)
Pb(II)
2.50 × 10 −10
Cu(II)
2.41 × 10 −10
Ni(II)
2.33 × 10 −10
Cd(II)
2.28 × 10 −10
Cr(VI)
2.25 × 10 −10
Zn(II)
2.26 × 10 −10
153
0
400
800
1200
1600
0.0
0.1
0.2
0.3
0.4
0.5
0
4000
8000
12000
0.0
0.5
1.0
1.5
2.0
2.5
0
400
800
1200
1600
0.0
0.1
0.2
0.3
0.4
0.5
0
400
800
1200
1600
0.0
0.1
0.2
0.3
0.4
0.5
0.6
0.7
0
400
800
1200
0.0
0.2
0.4
0.6
0.8
1.0
0
400
800
1200
1600
0.0
0.1
0.2
0.3
0.4
0.5
q
e
(mmol/g)
Time (min)
model
exp
q
e
(mmol/g)
Time (min)
model
exp
q
e
(mmol/g)
Time (min)
model
exp
q
e
(mmol/g)
Time (min)
model
exp
q
e
(mmol/g)
Time (min)
model
exp
Cu
2+
Pb
2+
Cd
2+
Ni
2+
Zn
2+
Cr
6+
q
e
(mmol/g)
Time (min)
model
exp
Fig. 7.10 Impact of contact time on binding of adsorbates
the experimental curve agreed well. All other parameters, including the adsorbent
maximum capacity and the pH model-determined adsorption equilibrium constant,
were applied in curve simulation. The effective diffusion coefficient (D eff ) obtained
by fitting the model with experimental data is shown in Table 7.6. The binding of
adsorbates happens primarily within the first 20 min in a study published by Vilar
et al. [39], and the removal of adsorbates is faster at the beginning of the experiment.
Table 7.6 Effective
coefficient of diffusion (D eff )
acquired by fitting the model
with experimental data
Adsorbates
D eff (m 2 /s)
Pb(II)
2.50 × 10 −10
Cu(II)
2.41 × 10 −10
Ni(II)
2.33 × 10 −10
Cd(II)
2.28 × 10 −10
Cr(VI)
2.25 × 10 −10
Zn(II)
2.26 × 10 −10