

7.6 Outcome of Characterization
149
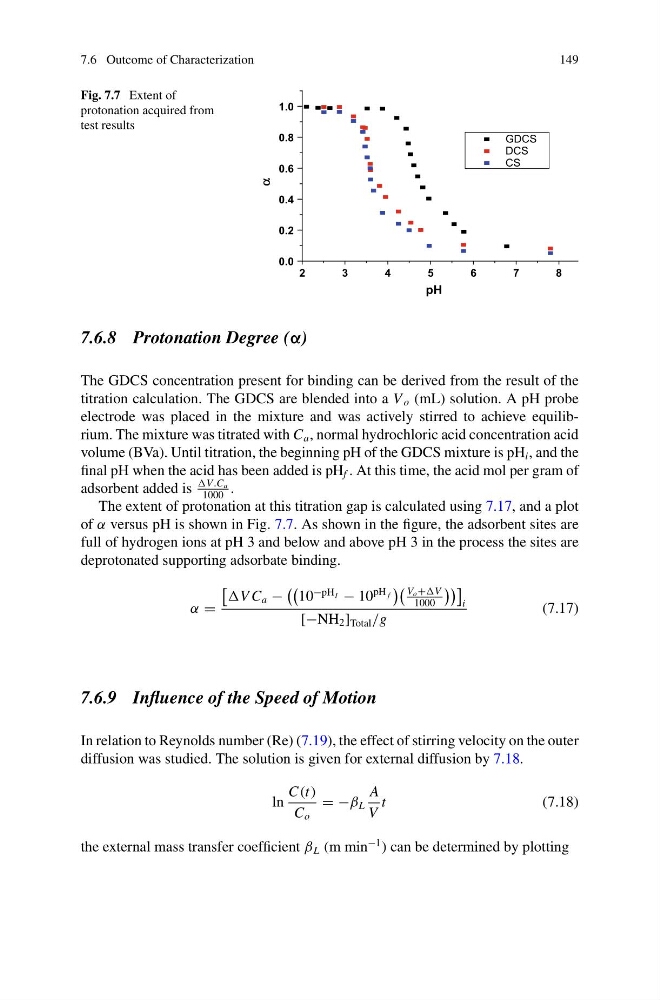
Fig. 7.7 Extent of
protonation acquired from
test results
2
3
4
5
6
7
8
0.0
0.2
0.4
0.6
0.8
1.0
α
pH
GDCS
DCS
CS
7.6.8 Protonation Degree (α)
The GDCS concentration present for binding can be derived from the result of the
titration calculation. The GDCS are blended into a V o (mL) solution. A pH probe
electrode was placed in the mixture and was actively stirred to achieve equilibrium. The mixture was titrated with C a , normal hydrochloric acid concentration acid
volume (BVa). Until titration, the beginning pH of the GDCS mixture is pH i , and the
final pH when the acid has been added is pH f . At this time, the acid mol per gram of
adsorbent added is
a
1000
.
The extent of protonation at this titration gap is calculated using 7.17, and a plot
of α versus pH is shown in Fig. 7.7. As shown in the figure, the adsorbent sites are
full of hydrogen ions at pH 3 and below and above pH 3 in the process the sites are
deprotonated supporting adsorbate binding.
α =
V C a −
10
−pH I − 10
pH f
V o +
1000
i
[−NH 2 ] Total /g
(7.17)
7.6.9 Influence of the Speed of Motion
In relation to Reynolds number (Re) (7.19), the effect of stirring velocity on the outer
diffusion was studied. The solution is given for external diffusion by 7.18.
ln
C(t)
C o
= −β L
A
V
t
(7.18)
the external mass transfer coefficient β L (m min
−1 ) can be determined by plotting
149
Fig. 7.7 Extent of
protonation acquired from
test results
2
3
4
5
6
7
8
0.0
0.2
0.4
0.6
0.8
1.0
α
pH
GDCS
DCS
CS
7.6.8 Protonation Degree (α)
The GDCS concentration present for binding can be derived from the result of the
titration calculation. The GDCS are blended into a V o (mL) solution. A pH probe
electrode was placed in the mixture and was actively stirred to achieve equilibrium. The mixture was titrated with C a , normal hydrochloric acid concentration acid
volume (BVa). Until titration, the beginning pH of the GDCS mixture is pH i , and the
final pH when the acid has been added is pH f . At this time, the acid mol per gram of
adsorbent added is
a
1000
.
The extent of protonation at this titration gap is calculated using 7.17, and a plot
of α versus pH is shown in Fig. 7.7. As shown in the figure, the adsorbent sites are
full of hydrogen ions at pH 3 and below and above pH 3 in the process the sites are
deprotonated supporting adsorbate binding.
α =
V C a −
10
−pH I − 10
pH f
V o +
1000
i
[−NH 2 ] Total /g
(7.17)
7.6.9 Influence of the Speed of Motion
In relation to Reynolds number (Re) (7.19), the effect of stirring velocity on the outer
diffusion was studied. The solution is given for external diffusion by 7.18.
ln
C(t)
C o
= −β L
A
V
t
(7.18)
the external mass transfer coefficient β L (m min
−1 ) can be determined by plotting