

126
6 Modelling of Packed Bed Column for the Adsorption …
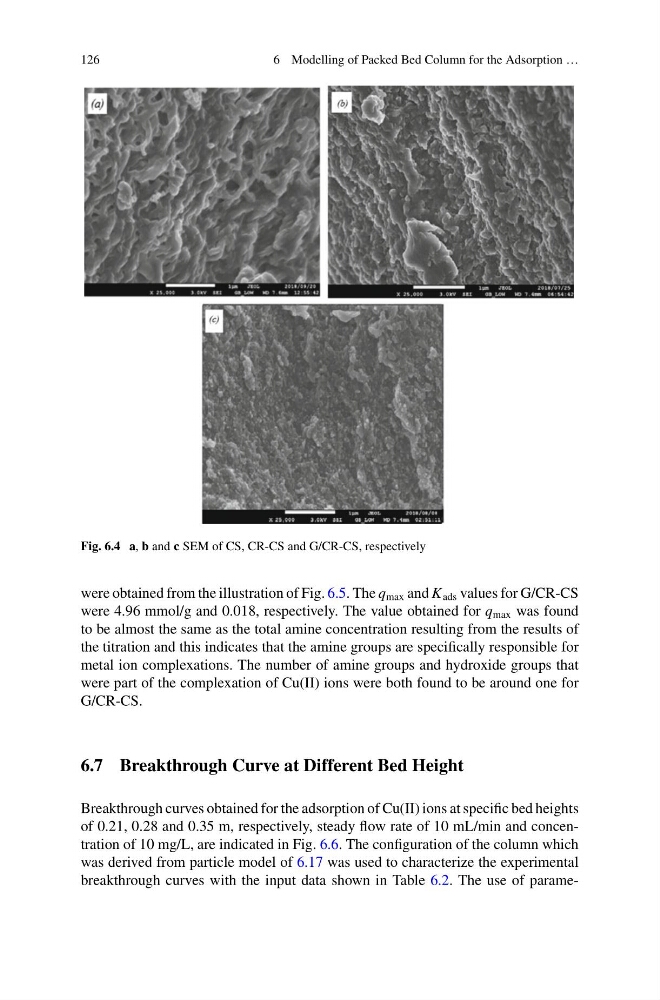
Fig. 6.4 a, b and c SEM of CS, CR-CS and G/CR-CS, respectively
were obtained from the illustration of Fig. 6.5. The q max and K ads values for G/CR-CS
were 4.96 mmol/g and 0.018, respectively. The value obtained for q max was found
to be almost the same as the total amine concentration resulting from the results of
the titration and this indicates that the amine groups are specifically responsible for
metal ion complexations. The number of amine groups and hydroxide groups that
were part of the complexation of Cu(II) ions were both found to be around one for
G/CR-CS.
6.7 Breakthrough Curve at Different Bed Height
Breakthrough curves obtained for the adsorption of Cu(II) ions at specific bed heights
of 0.21, 0.28 and 0.35 m, respectively, steady flow rate of 10 mL/min and concentration of 10 mg/L, are indicated in Fig. 6.6. The configuration of the column which
was derived from particle model of 6.17 was used to characterize the experimental
breakthrough curves with the input data shown in Table 6.2. The use of parame-
6 Modelling of Packed Bed Column for the Adsorption …
Fig. 6.4 a, b and c SEM of CS, CR-CS and G/CR-CS, respectively
were obtained from the illustration of Fig. 6.5. The q max and K ads values for G/CR-CS
were 4.96 mmol/g and 0.018, respectively. The value obtained for q max was found
to be almost the same as the total amine concentration resulting from the results of
the titration and this indicates that the amine groups are specifically responsible for
metal ion complexations. The number of amine groups and hydroxide groups that
were part of the complexation of Cu(II) ions were both found to be around one for
G/CR-CS.
6.7 Breakthrough Curve at Different Bed Height
Breakthrough curves obtained for the adsorption of Cu(II) ions at specific bed heights
of 0.21, 0.28 and 0.35 m, respectively, steady flow rate of 10 mL/min and concentration of 10 mg/L, are indicated in Fig. 6.6. The configuration of the column which
was derived from particle model of 6.17 was used to characterize the experimental
breakthrough curves with the input data shown in Table 6.2. The use of parame-