

6.4 Materials and Methods
125
loaded with Cu(II) ions and desorption studies were carried out. The spent G/CR-CS
was washed at various times before desorption, by subjecting the spent beads in the
column to 2 L of distilled water. Eventually, with the aid of a vacuum, the column
was sieved to extract all the water from the surface at a flow rate of 10 mL/min before
desorption at 10 mL/min with 0.1 M HC1. Upon desorption, the G/CR-CS was again
washed with distilled water to remove any residual acid.
6.5 Results and Discussion
6.5.1 Classification Result
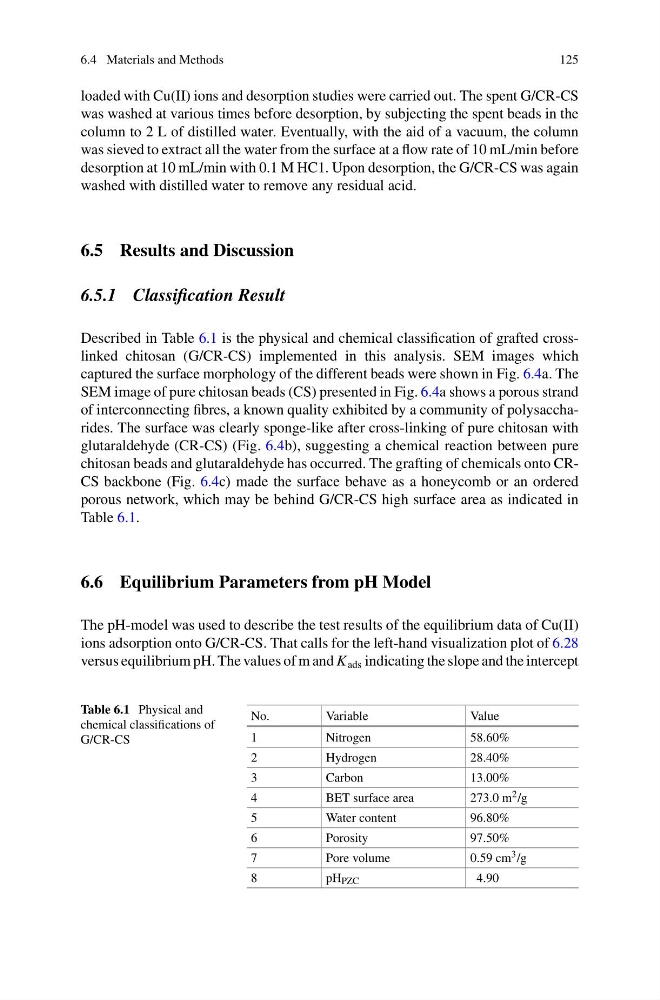
Described in Table 6.1 is the physical and chemical classification of grafted crosslinked chitosan (G/CR-CS) implemented in this analysis. SEM images which
captured the surface morphology of the different beads were shown in Fig. 6.4a. The
SEM image of pure chitosan beads (CS) presented in Fig. 6.4a shows a porous strand
of interconnecting fibres, a known quality exhibited by a community of polysaccharides. The surface was clearly sponge-like after cross-linking of pure chitosan with
glutaraldehyde (CR-CS) (Fig. 6.4b), suggesting a chemical reaction between pure
chitosan beads and glutaraldehyde has occurred. The grafting of chemicals onto CRCS backbone (Fig. 6.4c) made the surface behave as a honeycomb or an ordered
porous network, which may be behind G/CR-CS high surface area as indicated in
Table 6.1.
6.6 Equilibrium Parameters from pH Model
The pH-model was used to describe the test results of the equilibrium data of Cu(II)
ions adsorption onto G/CR-CS. That calls for the left-hand visualization plot of 6.28
versus equilibrium pH. The values of m and K ads indicating the slope and the intercept
Table 6.1 Physical and
chemical classifications of
G/CR-CS
No.
Variable
Value
1
Nitrogen
58.60%
2
Hydrogen
28.40%
3
Carbon
13.00%
4
BET surface area
273.0 m 2 /g
5
Water content
96.80%
6
Porosity
97.50%
7
Pore volume
0.59 cm 3 /g
8
pH PZC
4.90
125
loaded with Cu(II) ions and desorption studies were carried out. The spent G/CR-CS
was washed at various times before desorption, by subjecting the spent beads in the
column to 2 L of distilled water. Eventually, with the aid of a vacuum, the column
was sieved to extract all the water from the surface at a flow rate of 10 mL/min before
desorption at 10 mL/min with 0.1 M HC1. Upon desorption, the G/CR-CS was again
washed with distilled water to remove any residual acid.
6.5 Results and Discussion
6.5.1 Classification Result
Described in Table 6.1 is the physical and chemical classification of grafted crosslinked chitosan (G/CR-CS) implemented in this analysis. SEM images which
captured the surface morphology of the different beads were shown in Fig. 6.4a. The
SEM image of pure chitosan beads (CS) presented in Fig. 6.4a shows a porous strand
of interconnecting fibres, a known quality exhibited by a community of polysaccharides. The surface was clearly sponge-like after cross-linking of pure chitosan with
glutaraldehyde (CR-CS) (Fig. 6.4b), suggesting a chemical reaction between pure
chitosan beads and glutaraldehyde has occurred. The grafting of chemicals onto CRCS backbone (Fig. 6.4c) made the surface behave as a honeycomb or an ordered
porous network, which may be behind G/CR-CS high surface area as indicated in
Table 6.1.
6.6 Equilibrium Parameters from pH Model
The pH-model was used to describe the test results of the equilibrium data of Cu(II)
ions adsorption onto G/CR-CS. That calls for the left-hand visualization plot of 6.28
versus equilibrium pH. The values of m and K ads indicating the slope and the intercept
Table 6.1 Physical and
chemical classifications of
G/CR-CS
No.
Variable
Value
1
Nitrogen
58.60%
2
Hydrogen
28.40%
3
Carbon
13.00%
4
BET surface area
273.0 m 2 /g
5
Water content
96.80%
6
Porosity
97.50%
7
Pore volume
0.59 cm 3 /g
8
pH PZC
4.90