

6.7 Breakthrough Curve at Different Bed Height
127
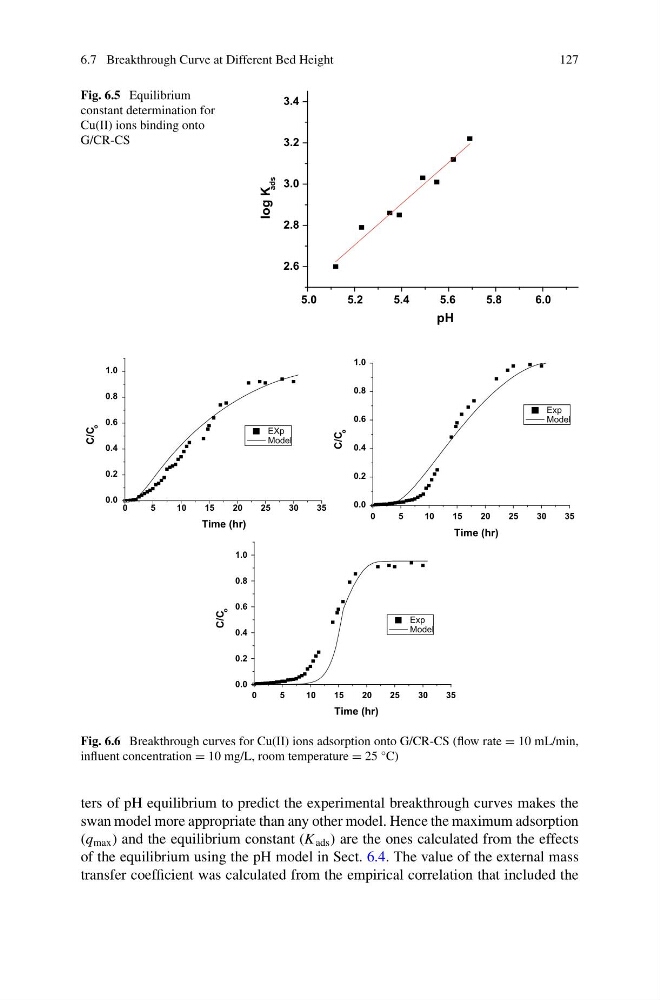
Fig. 6.5 Equilibrium
constant determination for
Cu(II) ions binding onto
G/CR-CS
5.0
5.2
5.4
5.6
5.8
6.0
2.6
2.8
3.0
3.2
3.4
log K
ads
pH
0
5
10
15
20
25
30
35
0.0
0.2
0.4
0.6
0.8
1.0
0
5
10
15
20
25
30
35
0.0
0.2
0.4
0.6
0.8
1.0
0
5
10
15
20
25
30
35
0.0
0.2
0.4
0.6
0.8
1.0
Exp
Model
C/C
o
Time (hr)
Exp
Model
C/C
o
Time (hr)
EXp
Model
C/C
o
Time (hr)
Fig. 6.6 Breakthrough curves for Cu(II) ions adsorption onto G/CR-CS (flow rate = 10 mL/min,
influent concentration = 10 mg/L, room temperature = 25 °C)
ters of pH equilibrium to predict the experimental breakthrough curves makes the
swan model more appropriate than any other model. Hence the maximum adsorption
(q max ) and the equilibrium constant (K ads ) are the ones calculated from the effects
of the equilibrium using the pH model in Sect. 6.4. The value of the external mass
transfer coefficient was calculated from the empirical correlation that included the
127
Fig. 6.5 Equilibrium
constant determination for
Cu(II) ions binding onto
G/CR-CS
5.0
5.2
5.4
5.6
5.8
6.0
2.6
2.8
3.0
3.2
3.4
log K
ads
pH
0
5
10
15
20
25
30
35
0.0
0.2
0.4
0.6
0.8
1.0
0
5
10
15
20
25
30
35
0.0
0.2
0.4
0.6
0.8
1.0
0
5
10
15
20
25
30
35
0.0
0.2
0.4
0.6
0.8
1.0
Exp
Model
C/C
o
Time (hr)
Exp
Model
C/C
o
Time (hr)
EXp
Model
C/C
o
Time (hr)
Fig. 6.6 Breakthrough curves for Cu(II) ions adsorption onto G/CR-CS (flow rate = 10 mL/min,
influent concentration = 10 mg/L, room temperature = 25 °C)
ters of pH equilibrium to predict the experimental breakthrough curves makes the
swan model more appropriate than any other model. Hence the maximum adsorption
(q max ) and the equilibrium constant (K ads ) are the ones calculated from the effects
of the equilibrium using the pH model in Sect. 6.4. The value of the external mass
transfer coefficient was calculated from the empirical correlation that included the