

120
6 Modelling of Packed Bed Column for the Adsorption …
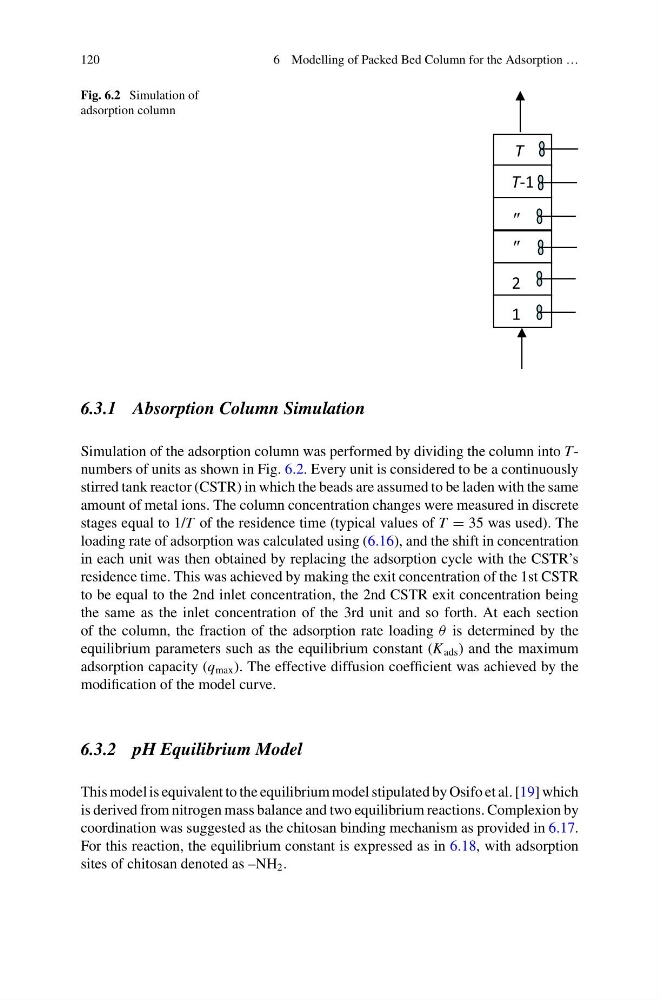
Fig. 6.2 Simulation of
adsorption column
6.3.1 Absorption Column Simulation
Simulation of the adsorption column was performed by dividing the column into Tnumbers of units as shown in Fig. 6.2. Every unit is considered to be a continuously
stirred tank reactor (CSTR) in which the beads are assumed to be laden with the same
amount of metal ions. The column concentration changes were measured in discrete
stages equal to 1/T of the residence time (typical values of T = 35 was used). The
loading rate of adsorption was calculated using (6.16), and the shift in concentration
in each unit was then obtained by replacing the adsorption cycle with the CSTR’s
residence time. This was achieved by making the exit concentration of the 1st CSTR
to be equal to the 2nd inlet concentration, the 2nd CSTR exit concentration being
the same as the inlet concentration of the 3rd unit and so forth. At each section
of the column, the fraction of the adsorption rate loading θ is determined by the
equilibrium parameters such as the equilibrium constant (K ads ) and the maximum
adsorption capacity (q max ). The effective diffusion coefficient was achieved by the
modification of the model curve.
6.3.2 pH Equilibrium Model
This model is equivalent to the equilibrium model stipulated by Osifo et al. [19] which
is derived from nitrogen mass balance and two equilibrium reactions. Complexion by
coordination was suggested as the chitosan binding mechanism as provided in 6.17.
For this reaction, the equilibrium constant is expressed as in 6.18, with adsorption
sites of chitosan denoted as –NH 2 .
6 Modelling of Packed Bed Column for the Adsorption …
Fig. 6.2 Simulation of
adsorption column
6.3.1 Absorption Column Simulation
Simulation of the adsorption column was performed by dividing the column into Tnumbers of units as shown in Fig. 6.2. Every unit is considered to be a continuously
stirred tank reactor (CSTR) in which the beads are assumed to be laden with the same
amount of metal ions. The column concentration changes were measured in discrete
stages equal to 1/T of the residence time (typical values of T = 35 was used). The
loading rate of adsorption was calculated using (6.16), and the shift in concentration
in each unit was then obtained by replacing the adsorption cycle with the CSTR’s
residence time. This was achieved by making the exit concentration of the 1st CSTR
to be equal to the 2nd inlet concentration, the 2nd CSTR exit concentration being
the same as the inlet concentration of the 3rd unit and so forth. At each section
of the column, the fraction of the adsorption rate loading θ is determined by the
equilibrium parameters such as the equilibrium constant (K ads ) and the maximum
adsorption capacity (q max ). The effective diffusion coefficient was achieved by the
modification of the model curve.
6.3.2 pH Equilibrium Model
This model is equivalent to the equilibrium model stipulated by Osifo et al. [19] which
is derived from nitrogen mass balance and two equilibrium reactions. Complexion by
coordination was suggested as the chitosan binding mechanism as provided in 6.17.
For this reaction, the equilibrium constant is expressed as in 6.18, with adsorption
sites of chitosan denoted as –NH 2 .