

5.6 The Effect of Flux on Adsorption
107
Table 5.3 Equivalent membrane volumes at which breakthrough occurs (pH = 5 and temperature
= 298 K) and the permeate concentration
Metal concentration (mmol L −1 )
Breakthrough equivalent membrane
volumes
C t (mmol L −1 )
0.762
43
0.081
1.533
22
0.142
7.651
5
0.152
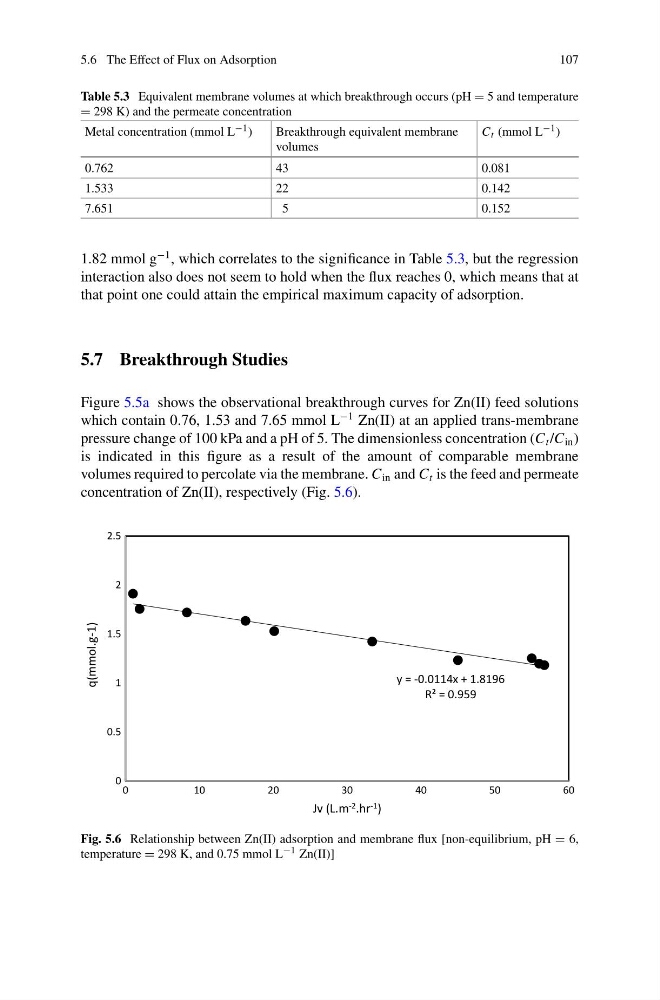
1.82 mmol g
−1 , which correlates to the significance in Table 5.3, but the regression
interaction also does not seem to hold when the flux reaches 0, which means that at
that point one could attain the empirical maximum capacity of adsorption.
5.7 Breakthrough Studies
Figure 5.5a shows the observational breakthrough curves for Zn(II) feed solutions
which contain 0.76, 1.53 and 7.65 mmol L
−1 Zn(II) at an applied trans-membrane
pressure change of 100 kPa and a pH of 5. The dimensionless concentration (C t /C in )
is indicated in this figure as a result of the amount of comparable membrane
volumes required to percolate via the membrane. C in and C t is the feed and permeate
concentration of Zn(II), respectively (Fig. 5.6).
y = -0.0114x + 1.8196
R² = 0.959
0
0.5
1
1.5
2
2.5
0
1 0
2 0
3 0
4 0
5 0
6 0
q(mmol.g-1)
Jv (L.m -2 .hr -1 )
Fig. 5.6 Relationship between Zn(II) adsorption and membrane flux [non-equilibrium, pH = 6,
temperature = 298 K, and 0.75 mmol L −1 Zn(II)]
107
Table 5.3 Equivalent membrane volumes at which breakthrough occurs (pH = 5 and temperature
= 298 K) and the permeate concentration
Metal concentration (mmol L −1 )
Breakthrough equivalent membrane
volumes
C t (mmol L −1 )
0.762
43
0.081
1.533
22
0.142
7.651
5
0.152
1.82 mmol g
−1 , which correlates to the significance in Table 5.3, but the regression
interaction also does not seem to hold when the flux reaches 0, which means that at
that point one could attain the empirical maximum capacity of adsorption.
5.7 Breakthrough Studies
Figure 5.5a shows the observational breakthrough curves for Zn(II) feed solutions
which contain 0.76, 1.53 and 7.65 mmol L
−1 Zn(II) at an applied trans-membrane
pressure change of 100 kPa and a pH of 5. The dimensionless concentration (C t /C in )
is indicated in this figure as a result of the amount of comparable membrane
volumes required to percolate via the membrane. C in and C t is the feed and permeate
concentration of Zn(II), respectively (Fig. 5.6).
y = -0.0114x + 1.8196
R² = 0.959
0
0.5
1
1.5
2
2.5
0
1 0
2 0
3 0
4 0
5 0
6 0
q(mmol.g-1)
Jv (L.m -2 .hr -1 )
Fig. 5.6 Relationship between Zn(II) adsorption and membrane flux [non-equilibrium, pH = 6,
temperature = 298 K, and 0.75 mmol L −1 Zn(II)]