

98
5 Biopolymer Chitosan Membranes Prepared from Fishery Waste …
5.3 Results and Discussion
5.3.1 Characterization Result
5.3.1.1 Outcome of FTIR Analysis
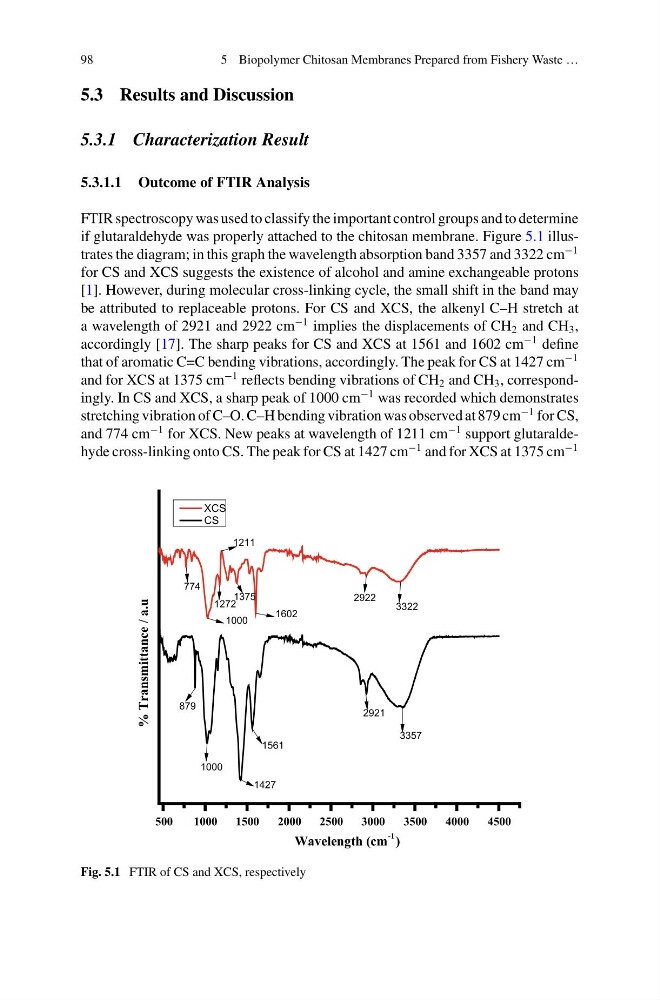
FTIR spectroscopy was used to classify the important control groups and to determine
if glutaraldehyde was properly attached to the chitosan membrane. Figure 5.1 illustrates the diagram; in this graph the wavelength absorption band 3357 and 3322 cm
−1
for CS and XCS suggests the existence of alcohol and amine exchangeable protons
[1]. However, during molecular cross-linking cycle, the small shift in the band may
be attributed to replaceable protons. For CS and XCS, the alkenyl C–H stretch at
a wavelength of 2921 and 2922 cm
−1 implies the displacements of CH 2 and CH 3 ,
accordingly [17]. The sharp peaks for CS and XCS at 1561 and 1602 cm
−1 define
that of aromatic C=C bending vibrations, accordingly. The peak for CS at 1427 cm
−1
and for XCS at 1375 cm
−1 reflects bending vibrations of CH 2 and CH 3 , correspondingly. In CS and XCS, a sharp peak of 1000 cm
−1 was recorded which demonstrates
stretching vibration of C–O. C–H bending vibration was observed at 879 cm
−1 for CS,
and 774 cm
−1 for XCS. New peaks at wavelength of 1211 cm
−1 support glutaraldehyde cross-linking onto CS. The peak for CS at 1427 cm
−1 and for XCS at 1375 cm
−1
500
1000
1500
2000
2500
3000
3500
4000
4500
% Transmittance / a.u
Wavelength (cm
-1 )
XCS
CS
1211
1272
3322
2922
1602
1375
1000
774
3357
2921
1561
1427
1000
879
Fig. 5.1 FTIR of CS and XCS, respectively
5 Biopolymer Chitosan Membranes Prepared from Fishery Waste …
5.3 Results and Discussion
5.3.1 Characterization Result
5.3.1.1 Outcome of FTIR Analysis
FTIR spectroscopy was used to classify the important control groups and to determine
if glutaraldehyde was properly attached to the chitosan membrane. Figure 5.1 illustrates the diagram; in this graph the wavelength absorption band 3357 and 3322 cm
−1
for CS and XCS suggests the existence of alcohol and amine exchangeable protons
[1]. However, during molecular cross-linking cycle, the small shift in the band may
be attributed to replaceable protons. For CS and XCS, the alkenyl C–H stretch at
a wavelength of 2921 and 2922 cm
−1 implies the displacements of CH 2 and CH 3 ,
accordingly [17]. The sharp peaks for CS and XCS at 1561 and 1602 cm
−1 define
that of aromatic C=C bending vibrations, accordingly. The peak for CS at 1427 cm
−1
and for XCS at 1375 cm
−1 reflects bending vibrations of CH 2 and CH 3 , correspondingly. In CS and XCS, a sharp peak of 1000 cm
−1 was recorded which demonstrates
stretching vibration of C–O. C–H bending vibration was observed at 879 cm
−1 for CS,
and 774 cm
−1 for XCS. New peaks at wavelength of 1211 cm
−1 support glutaraldehyde cross-linking onto CS. The peak for CS at 1427 cm
−1 and for XCS at 1375 cm
−1
500
1000
1500
2000
2500
3000
3500
4000
4500
% Transmittance / a.u
Wavelength (cm
-1 )
XCS
CS
1211
1272
3322
2922
1602
1375
1000
774
3357
2921
1561
1427
1000
879
Fig. 5.1 FTIR of CS and XCS, respectively