

23
commercial waste, food waste, institutional waste, street waste, industrial waste,
construction and demolition waste, and sanitation waste. MSW in India consists
mainly of compostable items (51–53%), recyclable (17–18%) (MOEF 2010) and
has C/N ratio approximately 32 with calorific value of about 1700–1800 Kcal/Kg
(Bhat et al. 2018). Only 10–12% of the total compostable waste is used for composting. About 60–90% of MSW generated in cities and towns are disposed off on
or into land in an unscientific manner causing environmental problems. The MSW
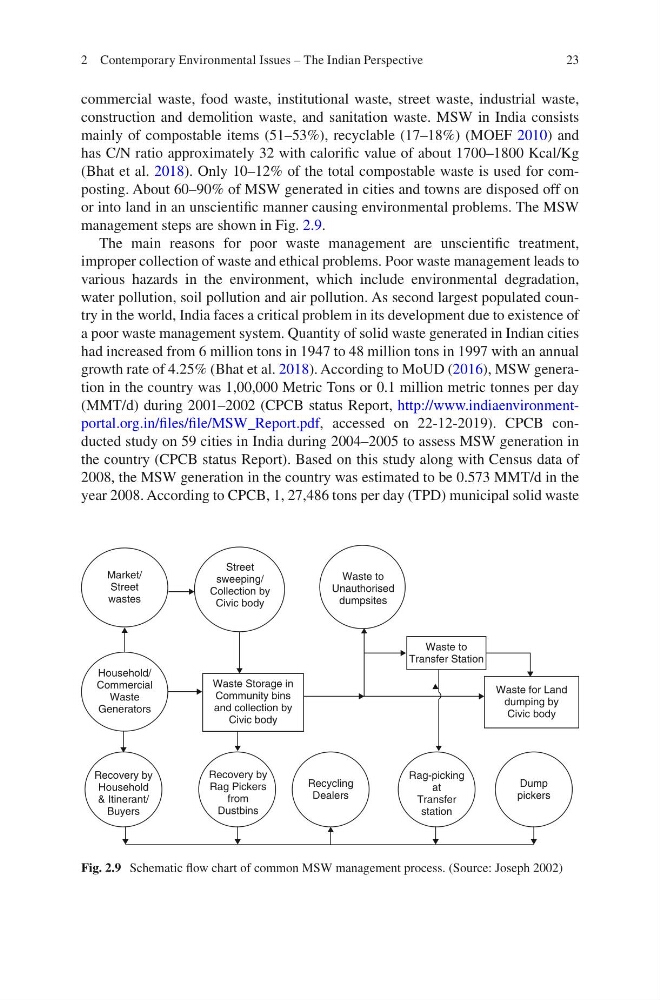
management steps are shown in Fig. 2.9.
The main reasons for poor waste management are unscientific treatment,
improper collection of waste and ethical problems. Poor waste management leads to
various hazards in the environment, which include environmental degradation,
water pollution, soil pollution and air pollution. As second largest populated country in the world, India faces a critical problem in its development due to existence of
a poor waste management system. Quantity of solid waste generated in Indian cities
had increased from 6 million tons in 1947 to 48 million tons in 1997 with an annual
growth rate of 4.25% (Bhat et al. 2018). According to MoUD (2016), MSW generation in the country was 1,00,000 Metric Tons or 0.1 million metric tonnes per day
(MMT/d) during 2001–2002 (CPCB status Report, http://www.indiaenvironmentportal.org.in/files/file/MSW_Report.pdf, accessed on 22-12-2019). CPCB conducted study on 59 cities in India during 2004–2005 to assess MSW generation in
the country (CPCB status Report). Based on this study along with Census data of
2008, the MSW generation in the country was estimated to be 0.573 MMT/d in the
year 2008. According to CPCB, 1, 27,486 tons per day (TPD) municipal solid waste
Market/
Street
wastes
Street
sweeping/
Collection by
Civic body
Waste to
Unauthorised
dumpsites
Waste to
Transfer Station
Waste Storage in
Community bins
and collection by
Civic body
Waste for Land
dumping by
Civic body
Dump
pickers
Recycling
Dealers
Recovery by
Rag Pickers
from
Dustbins
Recovery by
Household
& Itinerant/
Buyers
Household/
Commercial
Waste
Generators
Rag-picking
at
Transfer
station
Fig. 2.9 Schematic flow chart of common MSW management process. (Source: Joseph 2002)
2 Contemporary Environmental Issues – The Indian Perspective
commercial waste, food waste, institutional waste, street waste, industrial waste,
construction and demolition waste, and sanitation waste. MSW in India consists
mainly of compostable items (51–53%), recyclable (17–18%) (MOEF 2010) and
has C/N ratio approximately 32 with calorific value of about 1700–1800 Kcal/Kg
(Bhat et al. 2018). Only 10–12% of the total compostable waste is used for composting. About 60–90% of MSW generated in cities and towns are disposed off on
or into land in an unscientific manner causing environmental problems. The MSW
management steps are shown in Fig. 2.9.
The main reasons for poor waste management are unscientific treatment,
improper collection of waste and ethical problems. Poor waste management leads to
various hazards in the environment, which include environmental degradation,
water pollution, soil pollution and air pollution. As second largest populated country in the world, India faces a critical problem in its development due to existence of
a poor waste management system. Quantity of solid waste generated in Indian cities
had increased from 6 million tons in 1947 to 48 million tons in 1997 with an annual
growth rate of 4.25% (Bhat et al. 2018). According to MoUD (2016), MSW generation in the country was 1,00,000 Metric Tons or 0.1 million metric tonnes per day
(MMT/d) during 2001–2002 (CPCB status Report, http://www.indiaenvironmentportal.org.in/files/file/MSW_Report.pdf, accessed on 22-12-2019). CPCB conducted study on 59 cities in India during 2004–2005 to assess MSW generation in
the country (CPCB status Report). Based on this study along with Census data of
2008, the MSW generation in the country was estimated to be 0.573 MMT/d in the
year 2008. According to CPCB, 1, 27,486 tons per day (TPD) municipal solid waste
Market/
Street
wastes
Street
sweeping/
Collection by
Civic body
Waste to
Unauthorised
dumpsites
Waste to
Transfer Station
Waste Storage in
Community bins
and collection by
Civic body
Waste for Land
dumping by
Civic body
Dump
pickers
Recycling
Dealers
Recovery by
Rag Pickers
from
Dustbins
Recovery by
Household
& Itinerant/
Buyers
Household/
Commercial
Waste
Generators
Rag-picking
at
Transfer
station
Fig. 2.9 Schematic flow chart of common MSW management process. (Source: Joseph 2002)
2 Contemporary Environmental Issues – The Indian Perspective