

16
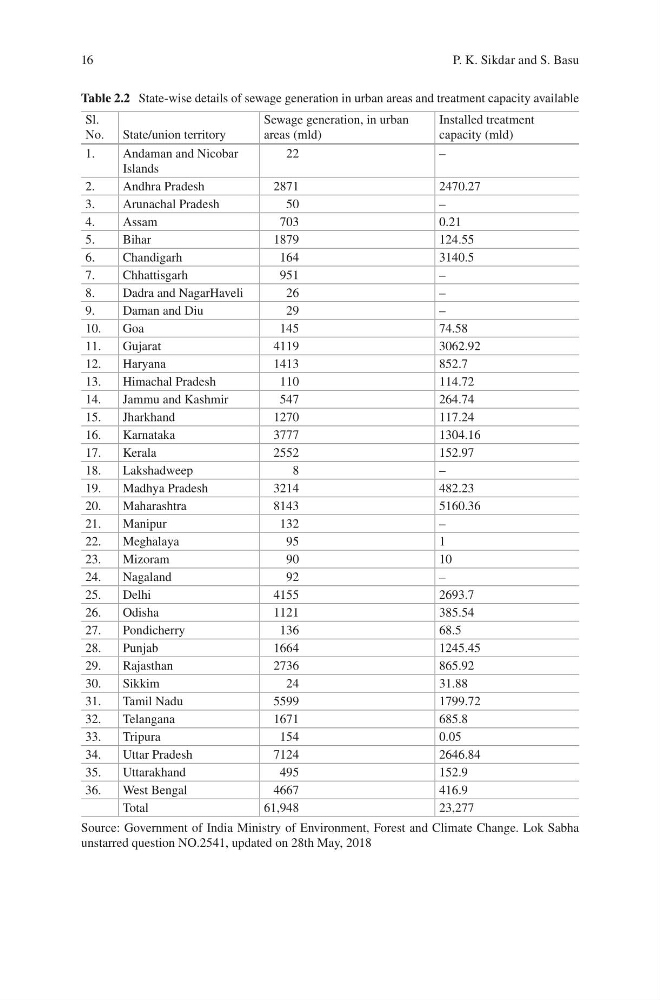
Table 2.2 State-wise details of sewage generation in urban areas and treatment capacity available
Sl.
No. State/union territory
Sewage generation, in urban
areas (mld)
Installed treatment
capacity (mld)
1.
Andaman and Nicobar
Islands
22
–
2.
Andhra Pradesh
2871
2470.27
3.
Arunachal Pradesh
50
–
4.
Assam
703
0.21
5.
Bihar
1879
124.55
6.
Chandigarh
164
3140.5
7.
Chhattisgarh
951
–
8.
Dadra and NagarHaveli
26
–
9.
Daman and Diu
29
–
10.
Goa
145
74.58
11.
Gujarat
4119
3062.92
12.
Haryana
1413
852.7
13.
Himachal Pradesh
110
114.72
14.
Jammu and Kashmir
547
264.74
15.
Jharkhand
1270
117.24
16.
Karnataka
3777
1304.16
17.
Kerala
2552
152.97
18.
Lakshadweep
8
–
19.
Madhya Pradesh
3214
482.23
20.
Maharashtra
8143
5160.36
21.
Manipur
132
–
22.
Meghalaya
95
1
23.
Mizoram
90
10
24.
Nagaland
92
–
25.
Delhi
4155
2693.7
26.
Odisha
1121
385.54
27.
Pondicherry
136
68.5
28.
Punjab
1664
1245.45
29.
Rajasthan
2736
865.92
30.
Sikkim
24
31.88
31.
Tamil Nadu
5599
1799.72
32.
Telangana
1671
685.8
33.
Tripura
154
0.05
34.
Uttar Pradesh
7124
2646.84
35.
Uttarakhand
495
152.9
36.
West Bengal
4667
416.9
Total
61,948
23,277
Source: Government of India Ministry of Environment, Forest and Climate Change. Lok Sabha
unstarred question NO.2541, updated on 28th May, 2018
P. K. Sikdar and S. Basu
Table 2.2 State-wise details of sewage generation in urban areas and treatment capacity available
Sl.
No. State/union territory
Sewage generation, in urban
areas (mld)
Installed treatment
capacity (mld)
1.
Andaman and Nicobar
Islands
22
–
2.
Andhra Pradesh
2871
2470.27
3.
Arunachal Pradesh
50
–
4.
Assam
703
0.21
5.
Bihar
1879
124.55
6.
Chandigarh
164
3140.5
7.
Chhattisgarh
951
–
8.
Dadra and NagarHaveli
26
–
9.
Daman and Diu
29
–
10.
Goa
145
74.58
11.
Gujarat
4119
3062.92
12.
Haryana
1413
852.7
13.
Himachal Pradesh
110
114.72
14.
Jammu and Kashmir
547
264.74
15.
Jharkhand
1270
117.24
16.
Karnataka
3777
1304.16
17.
Kerala
2552
152.97
18.
Lakshadweep
8
–
19.
Madhya Pradesh
3214
482.23
20.
Maharashtra
8143
5160.36
21.
Manipur
132
–
22.
Meghalaya
95
1
23.
Mizoram
90
10
24.
Nagaland
92
–
25.
Delhi
4155
2693.7
26.
Odisha
1121
385.54
27.
Pondicherry
136
68.5
28.
Punjab
1664
1245.45
29.
Rajasthan
2736
865.92
30.
Sikkim
24
31.88
31.
Tamil Nadu
5599
1799.72
32.
Telangana
1671
685.8
33.
Tripura
154
0.05
34.
Uttar Pradesh
7124
2646.84
35.
Uttarakhand
495
152.9
36.
West Bengal
4667
416.9
Total
61,948
23,277
Source: Government of India Ministry of Environment, Forest and Climate Change. Lok Sabha
unstarred question NO.2541, updated on 28th May, 2018
P. K. Sikdar and S. Basu