

15
pollution in India can be described in terms of surface water pollution and groundwater pollution.
Surface Water Pollution
The annual average surface water availability in India is 690 BCM (Niti Aayog
2019). Nearly 92% of the total runoff in India is contributed by 12 major and 46
medium river basins. According to World Economic Forum, 70% of the total surface water resource in India is unfit for consumption. The main source of surface
water pollution in India can be attributed to industrial effluent discharge, agricultural runoff and disposal of untreated sewage water into the rivers.
The discharge of waste water into the river results in high metal concentration
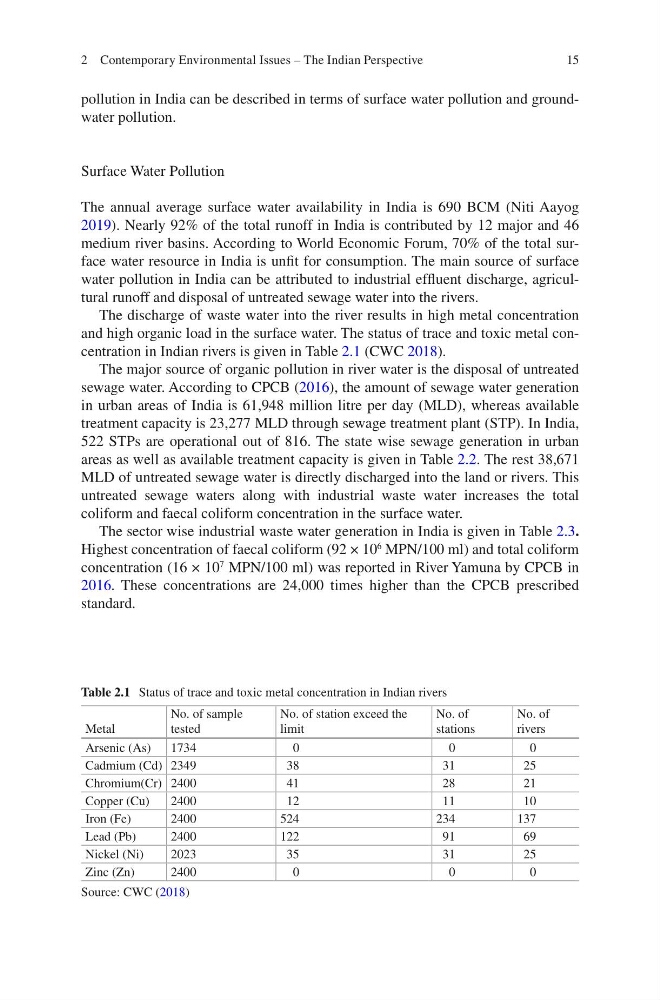
and high organic load in the surface water. The status of trace and toxic metal concentration in Indian rivers is given in Table 2.1 (CWC 2018).
The major source of organic pollution in river water is the disposal of untreated
sewage water. According to CPCB (2016), the amount of sewage water generation
in urban areas of India is 61,948 million litre per day (MLD), whereas available
treatment capacity is 23,277 MLD through sewage treatment plant (STP). In India,
522 STPs are operational out of 816. The state wise sewage generation in urban
areas as well as available treatment capacity is given in Table 2.2. The rest 38,671
MLD of untreated sewage water is directly discharged into the land or rivers. This
untreated sewage waters along with industrial waste water increases the total
coliform and faecal coliform concentration in the surface water.
The sector wise industrial waste water generation in India is given in Table 2.3.
Highest concentration of faecal coliform (92 × 10
6
MPN/100 ml) and total coliform
concentration (16 × 10
7
MPN/100 ml) was reported in River Yamuna by CPCB in
2016. These concentrations are 24,000 times higher than the CPCB prescribed
standard.
Table 2.1 Status of trace and toxic metal concentration in Indian rivers
Metal
No. of sample
tested
No. of station exceed the
limit
No. of
stations
No. of
rivers
Arsenic (As)
1734
0
0
0
Cadmium (Cd) 2349
38
31
25
Chromium(Cr) 2400
41
28
21
Copper (Cu)
2400
12
11
10
Iron (Fe)
2400
524
234
137
Lead (Pb)
2400
122
91
69
Nickel (Ni)
2023
35
31
25
Zinc (Zn)
2400
0
0
0
Source: CWC (2018)
2 Contemporary Environmental Issues – The Indian Perspective
pollution in India can be described in terms of surface water pollution and groundwater pollution.
Surface Water Pollution
The annual average surface water availability in India is 690 BCM (Niti Aayog
2019). Nearly 92% of the total runoff in India is contributed by 12 major and 46
medium river basins. According to World Economic Forum, 70% of the total surface water resource in India is unfit for consumption. The main source of surface
water pollution in India can be attributed to industrial effluent discharge, agricultural runoff and disposal of untreated sewage water into the rivers.
The discharge of waste water into the river results in high metal concentration
and high organic load in the surface water. The status of trace and toxic metal concentration in Indian rivers is given in Table 2.1 (CWC 2018).
The major source of organic pollution in river water is the disposal of untreated
sewage water. According to CPCB (2016), the amount of sewage water generation
in urban areas of India is 61,948 million litre per day (MLD), whereas available
treatment capacity is 23,277 MLD through sewage treatment plant (STP). In India,
522 STPs are operational out of 816. The state wise sewage generation in urban
areas as well as available treatment capacity is given in Table 2.2. The rest 38,671
MLD of untreated sewage water is directly discharged into the land or rivers. This
untreated sewage waters along with industrial waste water increases the total
coliform and faecal coliform concentration in the surface water.
The sector wise industrial waste water generation in India is given in Table 2.3.
Highest concentration of faecal coliform (92 × 10
6
MPN/100 ml) and total coliform
concentration (16 × 10
7
MPN/100 ml) was reported in River Yamuna by CPCB in
2016. These concentrations are 24,000 times higher than the CPCB prescribed
standard.
Table 2.1 Status of trace and toxic metal concentration in Indian rivers
Metal
No. of sample
tested
No. of station exceed the
limit
No. of
stations
No. of
rivers
Arsenic (As)
1734
0
0
0
Cadmium (Cd) 2349
38
31
25
Chromium(Cr) 2400
41
28
21
Copper (Cu)
2400
12
11
10
Iron (Fe)
2400
524
234
137
Lead (Pb)
2400
122
91
69
Nickel (Ni)
2023
35
31
25
Zinc (Zn)
2400
0
0
0
Source: CWC (2018)
2 Contemporary Environmental Issues – The Indian Perspective