

254
2008 and 2011 were mostly below 40 in large parts of the area. Hence it has been
considered as drought year. On the other hand, 2002, 2012 and 2013 had values
above 60 and are considered as normal years. The district- wise monthly VCI during
the study period has been graphically represented in Figure 14.5, which shows that
Purulia, Bankura, and Paschim Medinipur are the worst-affected districts during the
drought years for July and August. The Purba Medinipur district has experienced
relatively better conditions as the VCI values have not been lesser than that of 40.
14.4.2 Drought Monitoring Through RAI
In order to monitor the agricultural drought and identify a parity with the results
obtained from VCI, the RAI was calculated. Figure 14.6 represents the rainfall
departure condition from normal rainfall for 2 months (July and August) that is the
peak crop-growing months of the Kharif season for the year 1998 to 2017. It was
found that severe meteorological drought condition prevailed during Kharif season
of the year 2000–2001, 2008, and 2010–2011 over Purulia, Bankura, and Paschim
Medinipur districts and over Purba Medinipur district. The spatial variability and
intensity of drought were evident from the RAI maps shown in Fig. 14.6. Low RAI
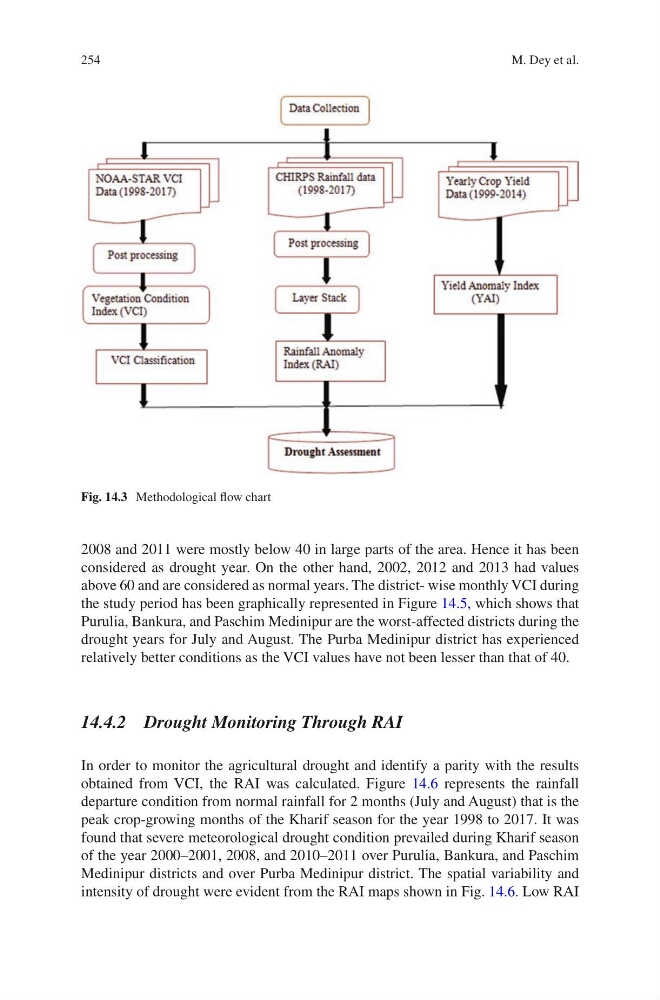
Fig. 14.3 Methodological flow chart
M. Dey et al.
2008 and 2011 were mostly below 40 in large parts of the area. Hence it has been
considered as drought year. On the other hand, 2002, 2012 and 2013 had values
above 60 and are considered as normal years. The district- wise monthly VCI during
the study period has been graphically represented in Figure 14.5, which shows that
Purulia, Bankura, and Paschim Medinipur are the worst-affected districts during the
drought years for July and August. The Purba Medinipur district has experienced
relatively better conditions as the VCI values have not been lesser than that of 40.
14.4.2 Drought Monitoring Through RAI
In order to monitor the agricultural drought and identify a parity with the results
obtained from VCI, the RAI was calculated. Figure 14.6 represents the rainfall
departure condition from normal rainfall for 2 months (July and August) that is the
peak crop-growing months of the Kharif season for the year 1998 to 2017. It was
found that severe meteorological drought condition prevailed during Kharif season
of the year 2000–2001, 2008, and 2010–2011 over Purulia, Bankura, and Paschim
Medinipur districts and over Purba Medinipur district. The spatial variability and
intensity of drought were evident from the RAI maps shown in Fig. 14.6. Low RAI
Fig. 14.3 Methodological flow chart
M. Dey et al.