

255
values signify that the years had low rainfall, indicating negative departure from
mean rainfall which means it is a drought year (Rooy 1965; Barring and Hulme
1991; Otun and Adewumi 2009; Ganapuram et al. 2014).
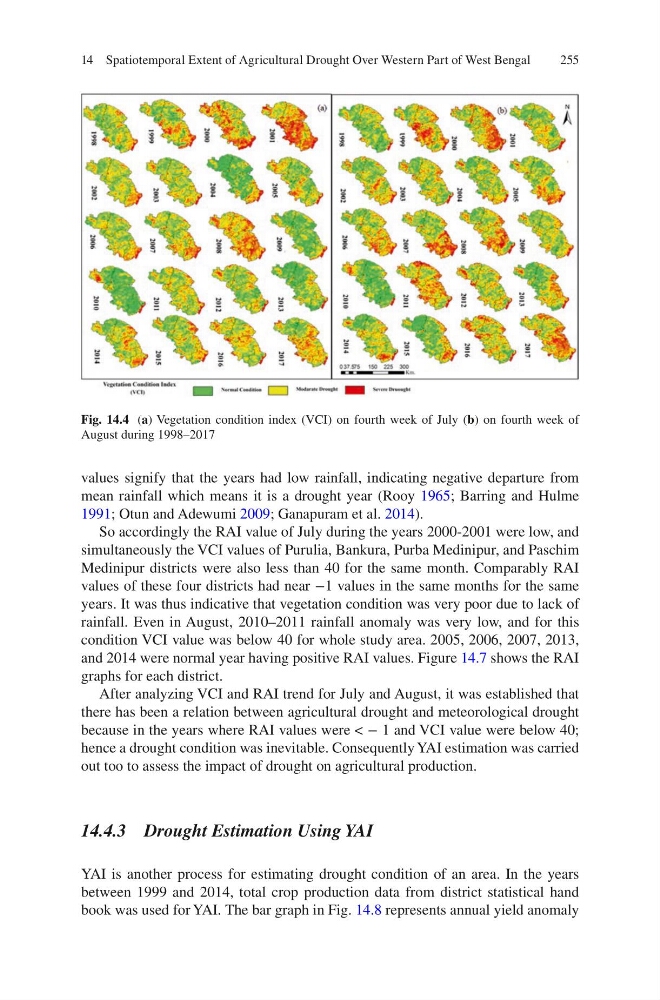
So accordingly the RAI value of July during the years 2000-2001 were low, and
simultaneously the VCI values of Purulia, Bankura, Purba Medinipur, and Paschim
Medinipur districts were also less than 40 for the same month. Comparably RAI
values of these four districts had near −1 values in the same months for the same
years. It was thus indicative that vegetation condition was very poor due to lack of
rainfall. Even in August, 2010–2011 rainfall anomaly was very low, and for this
condition VCI value was below 40 for whole study area. 2005, 2006, 2007, 2013,
and 2014 were normal year having positive RAI values. Figure 14.7 shows the RAI
graphs for each district.
After analyzing VCI and RAI trend for July and August, it was established that
there has been a relation between agricultural drought and meteorological drought
because in the years where RAI values were < − 1 and VCI value were below 40;
hence a drought condition was inevitable. Consequently YAI estimation was carried
out too to assess the impact of drought on agricultural production.
14.4.3 Drought Estimation Using YAI
YAI is another process for estimating drought condition of an area. In the years
between 1999 and 2014, total crop production data from district statistical hand
book was used for YAI. The bar graph in Fig. 14.8 represents annual yield anomaly
Fig. 14.4 (a) Vegetation condition index (VCI) on fourth week of July (b) on fourth week of
August during 1998–2017
14 Spatiotemporal Extent of Agricultural Drought Over Western Part of West Bengal
values signify that the years had low rainfall, indicating negative departure from
mean rainfall which means it is a drought year (Rooy 1965; Barring and Hulme
1991; Otun and Adewumi 2009; Ganapuram et al. 2014).
So accordingly the RAI value of July during the years 2000-2001 were low, and
simultaneously the VCI values of Purulia, Bankura, Purba Medinipur, and Paschim
Medinipur districts were also less than 40 for the same month. Comparably RAI
values of these four districts had near −1 values in the same months for the same
years. It was thus indicative that vegetation condition was very poor due to lack of
rainfall. Even in August, 2010–2011 rainfall anomaly was very low, and for this
condition VCI value was below 40 for whole study area. 2005, 2006, 2007, 2013,
and 2014 were normal year having positive RAI values. Figure 14.7 shows the RAI
graphs for each district.
After analyzing VCI and RAI trend for July and August, it was established that
there has been a relation between agricultural drought and meteorological drought
because in the years where RAI values were < − 1 and VCI value were below 40;
hence a drought condition was inevitable. Consequently YAI estimation was carried
out too to assess the impact of drought on agricultural production.
14.4.3 Drought Estimation Using YAI
YAI is another process for estimating drought condition of an area. In the years
between 1999 and 2014, total crop production data from district statistical hand
book was used for YAI. The bar graph in Fig. 14.8 represents annual yield anomaly
Fig. 14.4 (a) Vegetation condition index (VCI) on fourth week of July (b) on fourth week of
August during 1998–2017
14 Spatiotemporal Extent of Agricultural Drought Over Western Part of West Bengal