

253
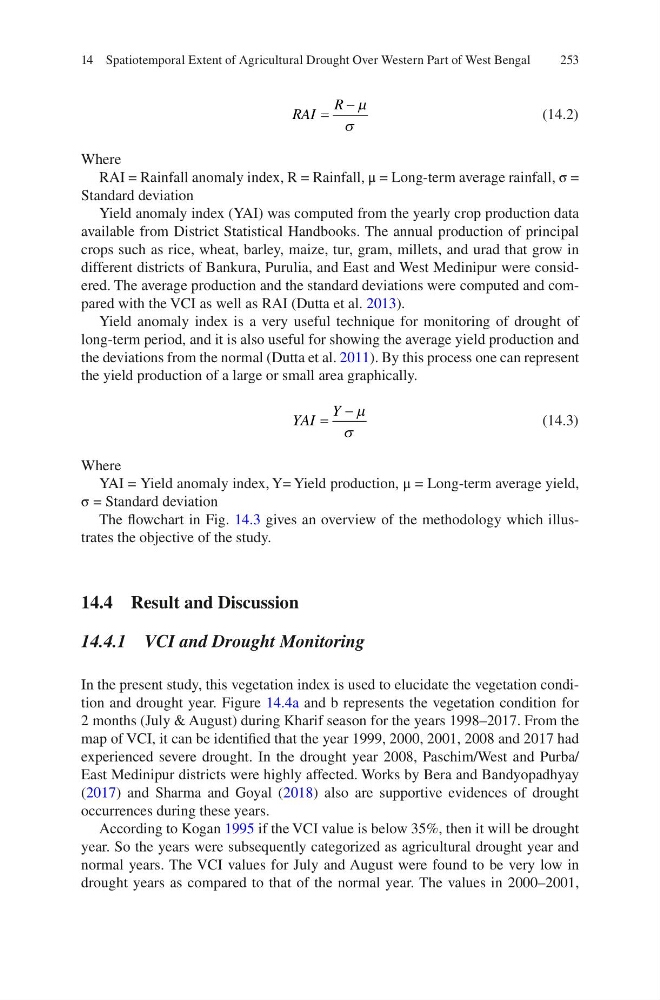
RAI
R
=
− µ
σ
(14.2)
Where
RAI = Rainfall anomaly index, R = Rainfall, μ = Long-term average rainfall, σ =
Standard deviation
Yield anomaly index (YAI) was computed from the yearly crop production data
available from District Statistical Handbooks. The annual production of principal
crops such as rice, wheat, barley, maize, tur, gram, millets, and urad that grow in
different districts of Bankura, Purulia, and East and West Medinipur were considered. The average production and the standard deviations were computed and compared with the VCI as well as RAI (Dutta et al. 2013).
Yield anomaly index is a very useful technique for monitoring of drought of
long-term period, and it is also useful for showing the average yield production and
the deviations from the normal (Dutta et al. 2011). By this process one can represent
the yield production of a large or small area graphically.
YAI
Y
=
− µ
σ
(14.3)
Where
YAI = Yield anomaly index, Y= Yield production, μ = Long-term average yield,
σ = Standard deviation
The flowchart in Fig. 14.3 gives an overview of the methodology which illustrates the objective of the study.
14.4 Result and Discussion
14.4.1 VCI and Drought Monitoring
In the present study, this vegetation index is used to elucidate the vegetation condition and drought year. Figure 14.4a and b represents the vegetation condition for
2 months (July & August) during Kharif season for the years 1998–2017. From the
map of VCI, it can be identified that the year 1999, 2000, 2001, 2008 and 2017 had
experienced severe drought. In the drought year 2008, Paschim/West and Purba/
East Medinipur districts were highly affected. Works by Bera and Bandyopadhyay
(2017) and Sharma and Goyal (2018) also are supportive evidences of drought
occurrences during these years.
According to Kogan 1995 if the VCI value is below 35%, then it will be drought
year. So the years were subsequently categorized as agricultural drought year and
normal years. The VCI values for July and August were found to be very low in
drought years as compared to that of the normal year. The values in 2000–2001,
14 Spatiotemporal Extent of Agricultural Drought Over Western Part of West Bengal
RAI
R
=
− µ
σ
(14.2)
Where
RAI = Rainfall anomaly index, R = Rainfall, μ = Long-term average rainfall, σ =
Standard deviation
Yield anomaly index (YAI) was computed from the yearly crop production data
available from District Statistical Handbooks. The annual production of principal
crops such as rice, wheat, barley, maize, tur, gram, millets, and urad that grow in
different districts of Bankura, Purulia, and East and West Medinipur were considered. The average production and the standard deviations were computed and compared with the VCI as well as RAI (Dutta et al. 2013).
Yield anomaly index is a very useful technique for monitoring of drought of
long-term period, and it is also useful for showing the average yield production and
the deviations from the normal (Dutta et al. 2011). By this process one can represent
the yield production of a large or small area graphically.
YAI
Y
=
− µ
σ
(14.3)
Where
YAI = Yield anomaly index, Y= Yield production, μ = Long-term average yield,
σ = Standard deviation
The flowchart in Fig. 14.3 gives an overview of the methodology which illustrates the objective of the study.
14.4 Result and Discussion
14.4.1 VCI and Drought Monitoring
In the present study, this vegetation index is used to elucidate the vegetation condition and drought year. Figure 14.4a and b represents the vegetation condition for
2 months (July & August) during Kharif season for the years 1998–2017. From the
map of VCI, it can be identified that the year 1999, 2000, 2001, 2008 and 2017 had
experienced severe drought. In the drought year 2008, Paschim/West and Purba/
East Medinipur districts were highly affected. Works by Bera and Bandyopadhyay
(2017) and Sharma and Goyal (2018) also are supportive evidences of drought
occurrences during these years.
According to Kogan 1995 if the VCI value is below 35%, then it will be drought
year. So the years were subsequently categorized as agricultural drought year and
normal years. The VCI values for July and August were found to be very low in
drought years as compared to that of the normal year. The values in 2000–2001,
14 Spatiotemporal Extent of Agricultural Drought Over Western Part of West Bengal