

233
13.4 Results and Discussion
13.4.1 Temporal Variation of Flood
Water discharge of the Ajay and Bhagirathi River is at its peak in the June–October
period due to huge rainfall in the monsoon season. It has been observed that the
maximum flood level varies each and every year since 1956. In the year of 1978,
1995, 1999 and 2000, the flood level exceeds the utmost level of flood for both the
gauge station Nutanhat and Gheropara.
13.4.2 Flood Frequency Analysis
Flood frequency analysis is a type of risk analysis where we use past observed data
related to flood (e.g. gauge level) to predict the future flood events along with their
return period and probabilities. Various kinds of methods can be applied to find out
the best suitable method for analysing the flood frequency of a particular site
(Deraman et al. 2017; Abdullah et al. 2018). Extreme value distributions are one of
the standardized methods of flood frequency analysis, and Gumbel’s extreme value
distribution is widely used for this type of analysis (Chow 1951; Chow et al. 1988;
Mukherjee 2013). Flood frequency analysis has been done for Gheropara and
Nutanhat stations, which are situated over the Ajay River. Gheropara and Nutanhat
are situated 55 km and 30 km in the upstream area from ketugram.
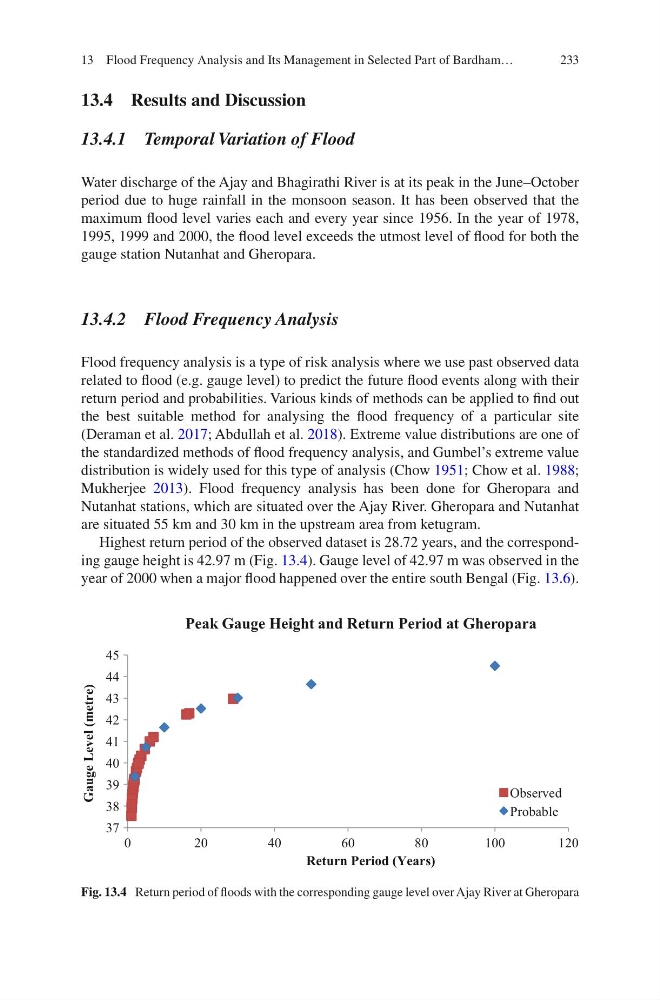
Highest return period of the observed dataset is 28.72 years, and the corresponding gauge height is 42.97 m (Fig. 13.4). Gauge level of 42.97 m was observed in the
year of 2000 when a major flood happened over the entire south Bengal (Fig. 13.6).
37
38
39
40
41
42
43
44
45
0
2 0
4 0
6 0
8 0
1 00
120
Gauge Level (metre)
Return Period (Years)
Peak Gauge Height and Return Period at Gheropara
Observed
Probable
Fig. 13.4 Return period of floods with the corresponding gauge level over Ajay River at Gheropara
13 Flood Frequency Analysis and Its Management in Selected Part of Bardham…
13.4 Results and Discussion
13.4.1 Temporal Variation of Flood
Water discharge of the Ajay and Bhagirathi River is at its peak in the June–October
period due to huge rainfall in the monsoon season. It has been observed that the
maximum flood level varies each and every year since 1956. In the year of 1978,
1995, 1999 and 2000, the flood level exceeds the utmost level of flood for both the
gauge station Nutanhat and Gheropara.
13.4.2 Flood Frequency Analysis
Flood frequency analysis is a type of risk analysis where we use past observed data
related to flood (e.g. gauge level) to predict the future flood events along with their
return period and probabilities. Various kinds of methods can be applied to find out
the best suitable method for analysing the flood frequency of a particular site
(Deraman et al. 2017; Abdullah et al. 2018). Extreme value distributions are one of
the standardized methods of flood frequency analysis, and Gumbel’s extreme value
distribution is widely used for this type of analysis (Chow 1951; Chow et al. 1988;
Mukherjee 2013). Flood frequency analysis has been done for Gheropara and
Nutanhat stations, which are situated over the Ajay River. Gheropara and Nutanhat
are situated 55 km and 30 km in the upstream area from ketugram.
Highest return period of the observed dataset is 28.72 years, and the corresponding gauge height is 42.97 m (Fig. 13.4). Gauge level of 42.97 m was observed in the
year of 2000 when a major flood happened over the entire south Bengal (Fig. 13.6).
37
38
39
40
41
42
43
44
45
0
2 0
4 0
6 0
8 0
1 00
120
Gauge Level (metre)
Return Period (Years)
Peak Gauge Height and Return Period at Gheropara
Observed
Probable
Fig. 13.4 Return period of floods with the corresponding gauge level over Ajay River at Gheropara
13 Flood Frequency Analysis and Its Management in Selected Part of Bardham…