

234
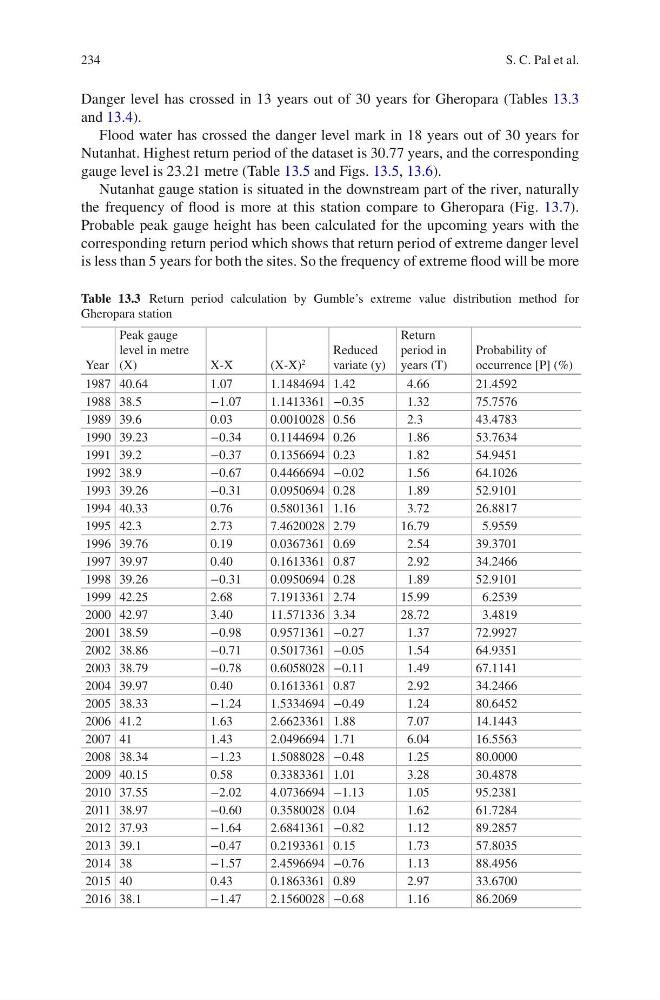
Table 13.3 Return period calculation by Gumble’s extreme value distribution method for
Gheropara station
Year
Peak gauge
level in metre
(X)
X-X̄
(X-X̄ )
2
Reduced
variate (y)
Return
period in
years (T)
Probability of
occurrence [P] (%)
1987 40.64
1.07
1.1484694 1.42
4.66
21.4592
1988 38.5
−1.07
1.1413361 −0.35
1.32
75.7576
1989 39.6
0.03
0.0010028 0.56
2.3
43.4783
1990 39.23
−0.34
0.1144694 0.26
1.86
53.7634
1991 39.2
−0.37
0.1356694 0.23
1.82
54.9451
1992 38.9
−0.67
0.4466694 −0.02
1.56
64.1026
1993 39.26
−0.31
0.0950694 0.28
1.89
52.9101
1994 40.33
0.76
0.5801361 1.16
3.72
26.8817
1995 42.3
2.73
7.4620028 2.79
16.79
5.9559
1996 39.76
0.19
0.0367361 0.69
2.54
39.3701
1997 39.97
0.40
0.1613361 0.87
2.92
34.2466
1998 39.26
−0.31
0.0950694 0.28
1.89
52.9101
1999 42.25
2.68
7.1913361 2.74
15.99
6.2539
2000 42.97
3.40
11.571336 3.34
28.72
3.4819
2001 38.59
−0.98
0.9571361 −0.27
1.37
72.9927
2002 38.86
−0.71
0.5017361 −0.05
1.54
64.9351
2003 38.79
−0.78
0.6058028 −0.11
1.49
67.1141
2004 39.97
0.40
0.1613361 0.87
2.92
34.2466
2005 38.33
−1.24
1.5334694 −0.49
1.24
80.6452
2006 41.2
1.63
2.6623361 1.88
7.07
14.1443
2007 41
1.43
2.0496694 1.71
6.04
16.5563
2008 38.34
−1.23
1.5088028 −0.48
1.25
80.0000
2009 40.15
0.58
0.3383361 1.01
3.28
30.4878
2010 37.55
−2.02
4.0736694 −1.13
1.05
95.2381
2011 38.97
−0.60
0.3580028 0.04
1.62
61.7284
2012 37.93
−1.64
2.6841361 −0.82
1.12
89.2857
2013 39.1
−0.47
0.2193361 0.15
1.73
57.8035
2014 38
−1.57
2.4596694 −0.76
1.13
88.4956
2015 40
0.43
0.1863361 0.89
2.97
33.6700
2016 38.1
−1.47
2.1560028 −0.68
1.16
86.2069
Danger level has crossed in 13 years out of 30 years for Gheropara (Tables 13.3
and 13.4).
Flood water has crossed the danger level mark in 18 years out of 30 years for
Nutanhat. Highest return period of the dataset is 30.77 years, and the corresponding
gauge level is 23.21 metre (Table 13.5 and Figs. 13.5, 13.6).
Nutanhat gauge station is situated in the downstream part of the river, naturally
the frequency of flood is more at this station compare to Gheropara (Fig. 13.7).
Probable peak gauge height has been calculated for the upcoming years with the
corresponding return period which shows that return period of extreme danger level
is less than 5 years for both the sites. So the frequency of extreme flood will be more
S. C. Pal et al.
Table 13.3 Return period calculation by Gumble’s extreme value distribution method for
Gheropara station
Year
Peak gauge
level in metre
(X)
X-X̄
(X-X̄ )
2
Reduced
variate (y)
Return
period in
years (T)
Probability of
occurrence [P] (%)
1987 40.64
1.07
1.1484694 1.42
4.66
21.4592
1988 38.5
−1.07
1.1413361 −0.35
1.32
75.7576
1989 39.6
0.03
0.0010028 0.56
2.3
43.4783
1990 39.23
−0.34
0.1144694 0.26
1.86
53.7634
1991 39.2
−0.37
0.1356694 0.23
1.82
54.9451
1992 38.9
−0.67
0.4466694 −0.02
1.56
64.1026
1993 39.26
−0.31
0.0950694 0.28
1.89
52.9101
1994 40.33
0.76
0.5801361 1.16
3.72
26.8817
1995 42.3
2.73
7.4620028 2.79
16.79
5.9559
1996 39.76
0.19
0.0367361 0.69
2.54
39.3701
1997 39.97
0.40
0.1613361 0.87
2.92
34.2466
1998 39.26
−0.31
0.0950694 0.28
1.89
52.9101
1999 42.25
2.68
7.1913361 2.74
15.99
6.2539
2000 42.97
3.40
11.571336 3.34
28.72
3.4819
2001 38.59
−0.98
0.9571361 −0.27
1.37
72.9927
2002 38.86
−0.71
0.5017361 −0.05
1.54
64.9351
2003 38.79
−0.78
0.6058028 −0.11
1.49
67.1141
2004 39.97
0.40
0.1613361 0.87
2.92
34.2466
2005 38.33
−1.24
1.5334694 −0.49
1.24
80.6452
2006 41.2
1.63
2.6623361 1.88
7.07
14.1443
2007 41
1.43
2.0496694 1.71
6.04
16.5563
2008 38.34
−1.23
1.5088028 −0.48
1.25
80.0000
2009 40.15
0.58
0.3383361 1.01
3.28
30.4878
2010 37.55
−2.02
4.0736694 −1.13
1.05
95.2381
2011 38.97
−0.60
0.3580028 0.04
1.62
61.7284
2012 37.93
−1.64
2.6841361 −0.82
1.12
89.2857
2013 39.1
−0.47
0.2193361 0.15
1.73
57.8035
2014 38
−1.57
2.4596694 −0.76
1.13
88.4956
2015 40
0.43
0.1863361 0.89
2.97
33.6700
2016 38.1
−1.47
2.1560028 −0.68
1.16
86.2069
Danger level has crossed in 13 years out of 30 years for Gheropara (Tables 13.3
and 13.4).
Flood water has crossed the danger level mark in 18 years out of 30 years for
Nutanhat. Highest return period of the dataset is 30.77 years, and the corresponding
gauge level is 23.21 metre (Table 13.5 and Figs. 13.5, 13.6).
Nutanhat gauge station is situated in the downstream part of the river, naturally
the frequency of flood is more at this station compare to Gheropara (Fig. 13.7).
Probable peak gauge height has been calculated for the upcoming years with the
corresponding return period which shows that return period of extreme danger level
is less than 5 years for both the sites. So the frequency of extreme flood will be more
S. C. Pal et al.