

232
where a = δn/Sx
Xf X Yn Sx n
= −
∗
(
)
/ δ
δn and Yn are given in the Gumbel’s extreme value distribution table, Sx is the
standard deviation of the data sets Sx
X X
n
= √
−
(
) −
( )
{
}
2
1
/
.
Probable peak values for the higher return period also can be calculated by using
the Gumble’s extreme value distribution method. The formula for the calculation of
probable values is
X X k Sx
t
t
= + ∗
where k
Y Yn
n
t
t
=
−
(
) / δ
Y
In In T T
t = −
−
(
)
{
}
/
1
X t is the probable peak value of the corresponding return period.
Collection of information,
data and maps
Topographical maps,
Geological map, Soil
map, rainfall data etc.
Satellite image
(LISS-IV)
Hydrological data
(e.g. gauge height)
Information
collected from the
field visit
Rectification, creation of
raster and vector layer
Flood Frequency
Analysis
Identification of vulnerable areas,
possible evacuation routes and
management strategies
Preparation of maps
and diagrams
Flood Inventory
Map
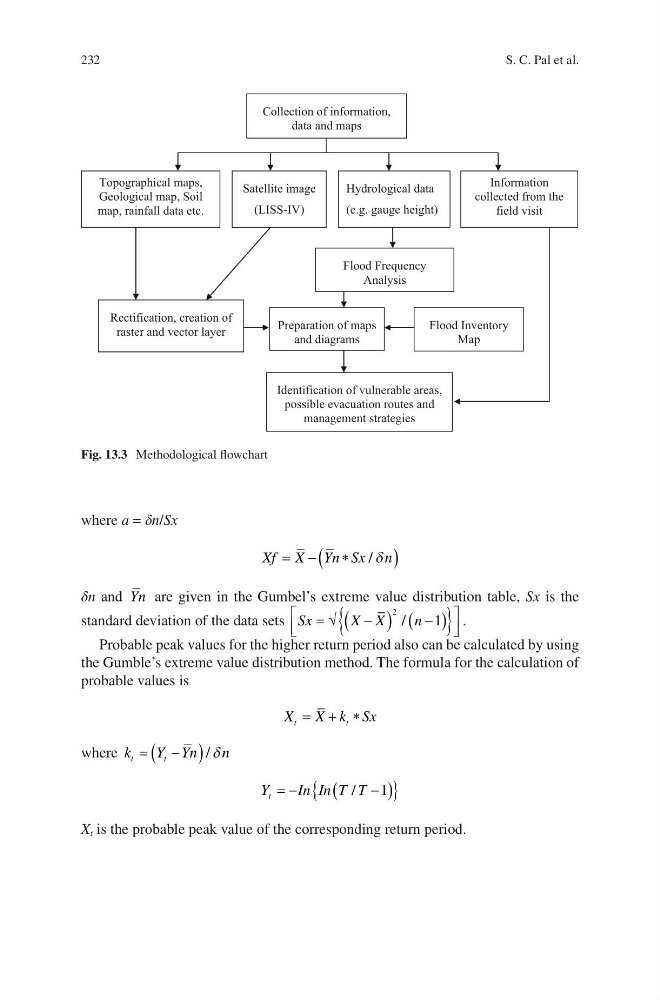
Fig. 13.3 Methodological flowchart
S. C. Pal et al.
where a = δn/Sx
Xf X Yn Sx n
= −
∗
(
)
/ δ
δn and Yn are given in the Gumbel’s extreme value distribution table, Sx is the
standard deviation of the data sets Sx
X X
n
= √
−
(
) −
( )
{
}
2
1
/
.
Probable peak values for the higher return period also can be calculated by using
the Gumble’s extreme value distribution method. The formula for the calculation of
probable values is
X X k Sx
t
t
= + ∗
where k
Y Yn
n
t
t
=
−
(
) / δ
Y
In In T T
t = −
−
(
)
{
}
/
1
X t is the probable peak value of the corresponding return period.
Collection of information,
data and maps
Topographical maps,
Geological map, Soil
map, rainfall data etc.
Satellite image
(LISS-IV)
Hydrological data
(e.g. gauge height)
Information
collected from the
field visit
Rectification, creation of
raster and vector layer
Flood Frequency
Analysis
Identification of vulnerable areas,
possible evacuation routes and
management strategies
Preparation of maps
and diagrams
Flood Inventory
Map
Fig. 13.3 Methodological flowchart
S. C. Pal et al.