

231
13.3 Materials and Methods
13.3.1 Data Used
Various types of datasets have been used in this study. Primary data related to the
problems of the people during flood, availability of government shelters and aid,
etc. has been collected from the local people during the field interview. Secondary
data related to the flood height and affected area has been collected from the
Irrigation and Waterways Directorate, Government of West Bengal. Survey of India
(SOI) topographical sheets (73 M/13, 73 M/14, 79A/1 and 79A/2) on 1:50,000
scales have been used as a base map for the preparation of this study. Contours
available on SOI topographical maps have been used for the preparation of slope
map. SRTM data, geological map (1:253,440 scale) published by Geological Survey
of India, was also used for the present study. Soil map published by National Bureau
of Soil Survey and Land Use Planning (NBSS&LUP) is also used for this study.
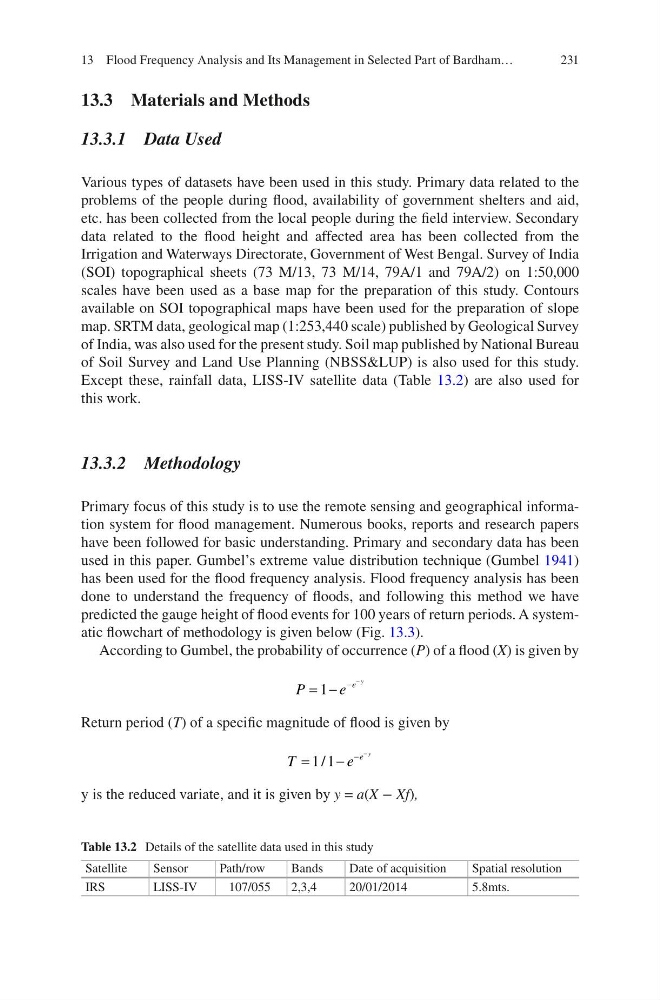
Except these, rainfall data, LISS-IV satellite data (Table 13.2) are also used for
this work.
13.3.2 Methodology
Primary focus of this study is to use the remote sensing and geographical information system for flood management. Numerous books, reports and research papers
have been followed for basic understanding. Primary and secondary data has been
used in this paper. Gumbel’s extreme value distribution technique (Gumbel 1941)
has been used for the flood frequency analysis. Flood frequency analysis has been
done to understand the frequency of floods, and following this method we have
predicted the gauge height of flood events for 100 years of return periods. A systematic flowchart of methodology is given below (Fig. 13.3).
According to Gumbel, the probability of occurrence (P) of a flood (X) is given by
P
e
e
y
= −
−
−
1
Return period (T) of a specific magnitude of flood is given by
T
e
e
y
=
−
−
−
1 1
/
y is the reduced variate, and it is given by y = a(X − Xf),
Table 13.2 Details of the satellite data used in this study
Satellite
Sensor
Path/row
Bands
Date of acquisition
Spatial resolution
IRS
LISS-IV
107/055
2,3,4
20/01/2014
5.8mts.
13 Flood Frequency Analysis and Its Management in Selected Part of Bardham…
13.3 Materials and Methods
13.3.1 Data Used
Various types of datasets have been used in this study. Primary data related to the
problems of the people during flood, availability of government shelters and aid,
etc. has been collected from the local people during the field interview. Secondary
data related to the flood height and affected area has been collected from the
Irrigation and Waterways Directorate, Government of West Bengal. Survey of India
(SOI) topographical sheets (73 M/13, 73 M/14, 79A/1 and 79A/2) on 1:50,000
scales have been used as a base map for the preparation of this study. Contours
available on SOI topographical maps have been used for the preparation of slope
map. SRTM data, geological map (1:253,440 scale) published by Geological Survey
of India, was also used for the present study. Soil map published by National Bureau
of Soil Survey and Land Use Planning (NBSS&LUP) is also used for this study.
Except these, rainfall data, LISS-IV satellite data (Table 13.2) are also used for
this work.
13.3.2 Methodology
Primary focus of this study is to use the remote sensing and geographical information system for flood management. Numerous books, reports and research papers
have been followed for basic understanding. Primary and secondary data has been
used in this paper. Gumbel’s extreme value distribution technique (Gumbel 1941)
has been used for the flood frequency analysis. Flood frequency analysis has been
done to understand the frequency of floods, and following this method we have
predicted the gauge height of flood events for 100 years of return periods. A systematic flowchart of methodology is given below (Fig. 13.3).
According to Gumbel, the probability of occurrence (P) of a flood (X) is given by
P
e
e
y
= −
−
−
1
Return period (T) of a specific magnitude of flood is given by
T
e
e
y
=
−
−
−
1 1
/
y is the reduced variate, and it is given by y = a(X − Xf),
Table 13.2 Details of the satellite data used in this study
Satellite
Sensor
Path/row
Bands
Date of acquisition
Spatial resolution
IRS
LISS-IV
107/055
2,3,4
20/01/2014
5.8mts.
13 Flood Frequency Analysis and Its Management in Selected Part of Bardham…