

171
bution of built-up area increased from 18.51 km
2
to 22.26 km
2
during 2010–2017
inside the municipality boundary. Moreover, outside the municipality boundary, the
distribution of built-up area also increased from 17.55 km
2
to 26.31 km
2
during
2010–2017. From Fig. 9.3 and Table 9.2, it is revealed that the increase rate of builtup area is much more intense outside the municipality than inside the municipality.
It is one of the indications of urban sprawl.
9.5.4 Periodic Built-Up Extension in Different Direction
The study area was divided into eight zones as per direction up to the outer boundary of the block at 45-degree interval gap where the central pixel of CBD is considered as the point of origin. As per direction or location zones, it includes
north-north-west (NNW), north-north-east (NNE), east-north-east (ENE), eastsouth- east (ESE), south-south-east (SSE), south-south-west (SSW), west-southwest (WSW) and west-north-west (WNW) which has been demarcated to know the
built-up extension and find the reasons behind the different extensions.
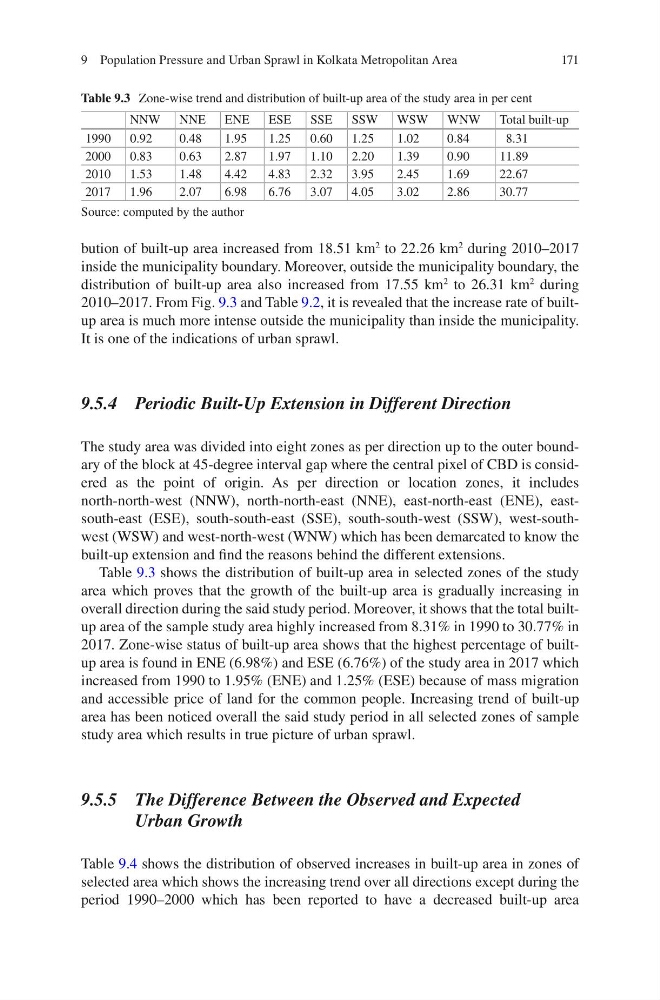
Table 9.3 shows the distribution of built-up area in selected zones of the study
area which proves that the growth of the built-up area is gradually increasing in
overall direction during the said study period. Moreover, it shows that the total builtup area of the sample study area highly increased from 8.31% in 1990 to 30.77% in
2017. Zone-wise status of built-up area shows that the highest percentage of builtup area is found in ENE (6.98%) and ESE (6.76%) of the study area in 2017 which
increased from 1990 to 1.95% (ENE) and 1.25% (ESE) because of mass migration
and accessible price of land for the common people. Increasing trend of built-up
area has been noticed overall the said study period in all selected zones of sample
study area which results in true picture of urban sprawl.
9.5.5 The Difference Between the Observed and Expected
Urban Growth
Table 9.4 shows the distribution of observed increases in built-up area in zones of
selected area which shows the increasing trend over all directions except during the
period 1990–2000 which has been reported to have a decreased built-up area
Table 9.3 Zone-wise trend and distribution of built-up area of the study area in per cent
NNW NNE ENE ESE SSE
SSW WSW WNW Total built-up
1990 0.92
0.48
1.95
1.25
0.60 1.25
1.02
0.84
8.31
2000 0.83
0.63
2.87
1.97
1.10 2.20
1.39
0.90
11.89
2010 1.53
1.48
4.42
4.83
2.32 3.95
2.45
1.69
22.67
2017 1.96
2.07
6.98
6.76
3.07 4.05
3.02
2.86
30.77
Source: computed by the author
9 Population Pressure and Urban Sprawl in Kolkata Metropolitan Area
bution of built-up area increased from 18.51 km
2
to 22.26 km
2
during 2010–2017
inside the municipality boundary. Moreover, outside the municipality boundary, the
distribution of built-up area also increased from 17.55 km
2
to 26.31 km
2
during
2010–2017. From Fig. 9.3 and Table 9.2, it is revealed that the increase rate of builtup area is much more intense outside the municipality than inside the municipality.
It is one of the indications of urban sprawl.
9.5.4 Periodic Built-Up Extension in Different Direction
The study area was divided into eight zones as per direction up to the outer boundary of the block at 45-degree interval gap where the central pixel of CBD is considered as the point of origin. As per direction or location zones, it includes
north-north-west (NNW), north-north-east (NNE), east-north-east (ENE), eastsouth- east (ESE), south-south-east (SSE), south-south-west (SSW), west-southwest (WSW) and west-north-west (WNW) which has been demarcated to know the
built-up extension and find the reasons behind the different extensions.
Table 9.3 shows the distribution of built-up area in selected zones of the study
area which proves that the growth of the built-up area is gradually increasing in
overall direction during the said study period. Moreover, it shows that the total builtup area of the sample study area highly increased from 8.31% in 1990 to 30.77% in
2017. Zone-wise status of built-up area shows that the highest percentage of builtup area is found in ENE (6.98%) and ESE (6.76%) of the study area in 2017 which
increased from 1990 to 1.95% (ENE) and 1.25% (ESE) because of mass migration
and accessible price of land for the common people. Increasing trend of built-up
area has been noticed overall the said study period in all selected zones of sample
study area which results in true picture of urban sprawl.
9.5.5 The Difference Between the Observed and Expected
Urban Growth
Table 9.4 shows the distribution of observed increases in built-up area in zones of
selected area which shows the increasing trend over all directions except during the
period 1990–2000 which has been reported to have a decreased built-up area
Table 9.3 Zone-wise trend and distribution of built-up area of the study area in per cent
NNW NNE ENE ESE SSE
SSW WSW WNW Total built-up
1990 0.92
0.48
1.95
1.25
0.60 1.25
1.02
0.84
8.31
2000 0.83
0.63
2.87
1.97
1.10 2.20
1.39
0.90
11.89
2010 1.53
1.48
4.42
4.83
2.32 3.95
2.45
1.69
22.67
2017 1.96
2.07
6.98
6.76
3.07 4.05
3.02
2.86
30.77
Source: computed by the author
9 Population Pressure and Urban Sprawl in Kolkata Metropolitan Area