

169
9.5.2 Population Growth
The periodic analysis showed that the population increased from 238,075 to 294,628
persons from 2001 to 2011 with a 23.75% growth (Table 9.1). The urban population
increased from 19,876 to 119,402 persons during the period of 2001 and 2011,
respectively, with a 500.73% growth in Barasat I CD Block. The growth of population in the municipality area (Barasat) decreased from 1991–2001 to 2001–2011
(125.52% and 20.26%, respectively) (Census of India, 1991, 2001 and 2011).
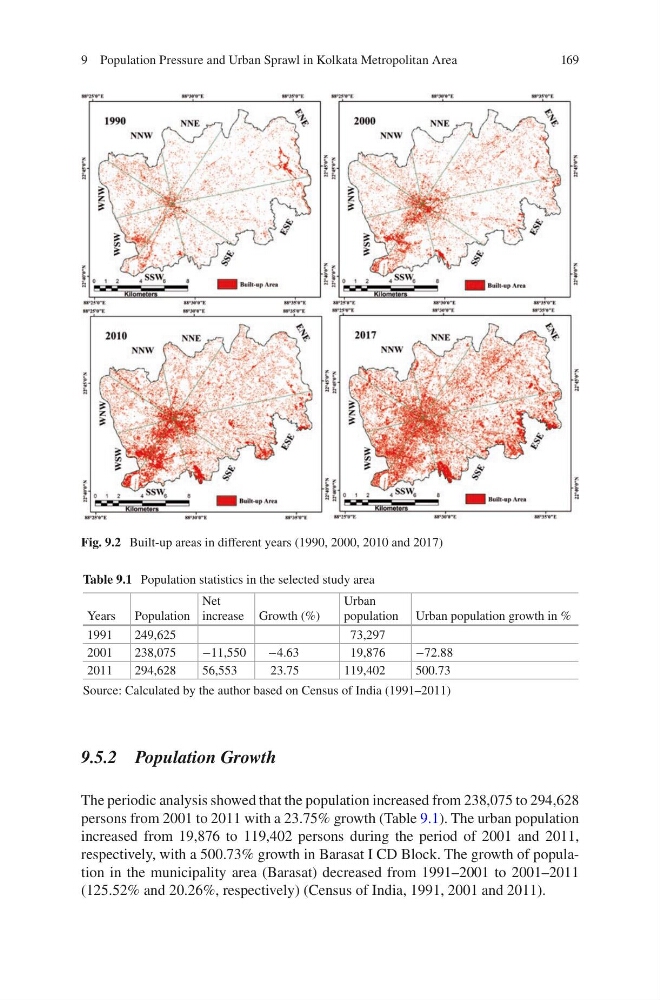
Fig. 9.2 Built-up areas in different years (1990, 2000, 2010 and 2017)
Table 9.1 Population statistics in the selected study area
Years Population
Net
increase Growth (%)
Urban
population Urban population growth in %
1991
249,625
73,297
2001
238,075
−11,550
−4.63
19,876
−72.88
2011
294,628
56,553
23.75
119,402
500.73
Source: Calculated by the author based on Census of India (1991–2011)
9 Population Pressure and Urban Sprawl in Kolkata Metropolitan Area
9.5.2 Population Growth
The periodic analysis showed that the population increased from 238,075 to 294,628
persons from 2001 to 2011 with a 23.75% growth (Table 9.1). The urban population
increased from 19,876 to 119,402 persons during the period of 2001 and 2011,
respectively, with a 500.73% growth in Barasat I CD Block. The growth of population in the municipality area (Barasat) decreased from 1991–2001 to 2001–2011
(125.52% and 20.26%, respectively) (Census of India, 1991, 2001 and 2011).
Fig. 9.2 Built-up areas in different years (1990, 2000, 2010 and 2017)
Table 9.1 Population statistics in the selected study area
Years Population
Net
increase Growth (%)
Urban
population Urban population growth in %
1991
249,625
73,297
2001
238,075
−11,550
−4.63
19,876
−72.88
2011
294,628
56,553
23.75
119,402
500.73
Source: Calculated by the author based on Census of India (1991–2011)
9 Population Pressure and Urban Sprawl in Kolkata Metropolitan Area