

153
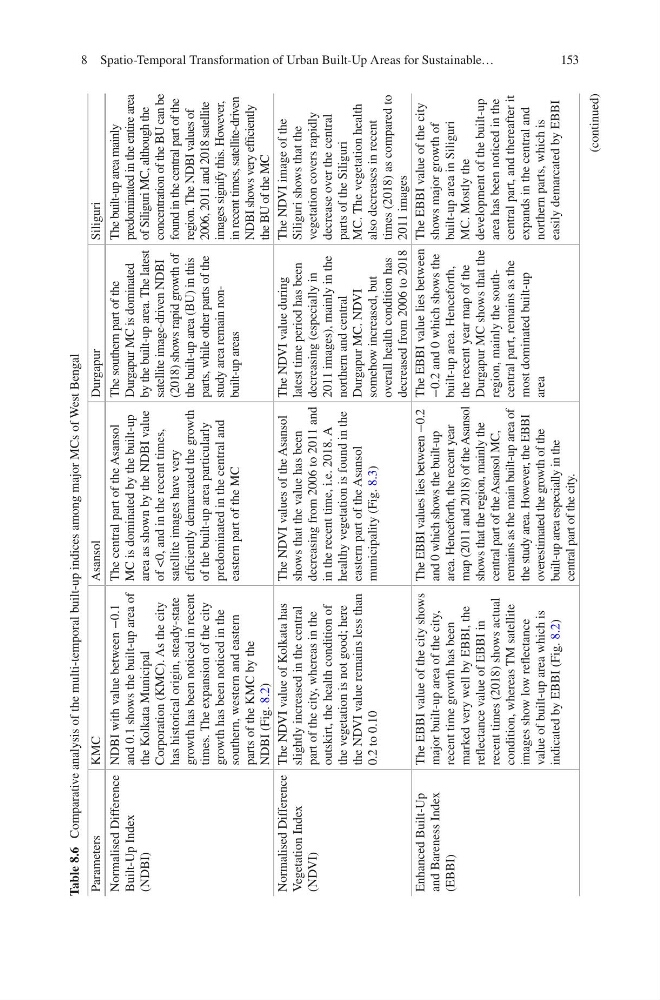
Table 8.6 Comparative analysis of the multi-temporal built-up indices among major MCs of West Bengal
Parameters
KMC
Asansol
Durgapur
Siliguri
Normalised Difference
Built-Up Index
(NDBI)
NDBI with value between
−0.1
and 0.1 shows the built-up area of
the Kolkata Municipal
Corporation (KMC). As the city
has historical origin, steady-state
growth has been noticed in recent
times. The expansion of the city
growth has been noticed in the
southern, western and eastern
parts of the KMC by the
NDBI (Fig. 8.2)
The central part of the Asansol
MC is dominated by the built-up
area as shown by the NDBI value
of <0, and in the recent times,
satellite images have very
efficiently demarcated the growth
of the built-up area particularly
predominated in the central and
eastern part of the MC
The southern part of the
Durgapur MC is dominated
by the built-up area. The latest
satellite image-driven NDBI
(2018) shows rapid growth of
the built-up area (BU) in this
parts, while other parts of the
study area remain nonbuilt-up areas
The built-up area mainly
predominated in the entire area
of Siliguri MC, although the
concentration of the BU can be
found in the central part of the
region. The NDBI values of
2006, 2011 and 2018 satellite
images signify this. However,
in recent times, satellite-driven
NDBI shows very efficiently
the BU of the MC
Normalised Difference
Vegetation Index
(NDVI)
The NDVI value of Kolkata has
slightly increased in the central
part of the city, whereas in the
outskirt, the health condition of
the vegetation is not good; here
the NDVI value remains less than
0.2 to 0.10
The NDVI values of the Asansol
shows that the value has been
decreasing from 2006 to 2011 and
in the recent time, i.e. 2018. A
healthy vegetation is found in the
eastern part of the Asansol
municipality (Fig. 8.3)
The NDVI value during
latest time period has been
decreasing (especially in
2011 images), mainly in the
northern and central
Durgapur MC. NDVI
somehow increased, but
overall health condition has
decreased from 2006 to 2018
The NDVI image of the
Siliguri shows that the
vegetation covers rapidly
decrease over the central
parts of the Siliguri
MC. The vegetation health
also decreases in recent
times (2018) as compared to
2011 images
Enhanced Built-Up
and Bareness Index
(EBBI)
The EBBI value of the city shows
major built-up area of the city,
recent time growth has been
marked very well by EBBI, the
reflectance value of EBBI in
recent times (2018) shows actual
condition, whereas TM satellite
images show low reflectance
value of built-up area which is
indicated by EBBI (Fig. 8.2)
The EBBI values lies between
−0.2
and 0 which shows the built-up
area. Henceforth, the recent year
map (2011 and 2018) of the Asansol
shows that the region, mainly the
central part of the Asansol MC,
remains as the main built-up area of
the study area. However, the EBBI
overestimated the growth of the
built-up area especially in the
central part of the city.
The EBBI value lies between
−0.2 and 0 which shows the
built-up area. Henceforth,
the recent year map of the
Durgapur MC shows that the
region, mainly the southcentral part, remains as the
most dominated built-up
area
The EBBI value of the city
shows major growth of
built-up area in Siliguri
MC. Mostly the
development of the built-up
area has been noticed in the
central part, and thereafter it
expands in the central and
northern parts, which is
easily demarcated by EBBI
(continued)
8 Spatio-Temporal Transformation of Urban Built-Up Areas for Sustainable…
Table 8.6 Comparative analysis of the multi-temporal built-up indices among major MCs of West Bengal
Parameters
KMC
Asansol
Durgapur
Siliguri
Normalised Difference
Built-Up Index
(NDBI)
NDBI with value between
−0.1
and 0.1 shows the built-up area of
the Kolkata Municipal
Corporation (KMC). As the city
has historical origin, steady-state
growth has been noticed in recent
times. The expansion of the city
growth has been noticed in the
southern, western and eastern
parts of the KMC by the
NDBI (Fig. 8.2)
The central part of the Asansol
MC is dominated by the built-up
area as shown by the NDBI value
of <0, and in the recent times,
satellite images have very
efficiently demarcated the growth
of the built-up area particularly
predominated in the central and
eastern part of the MC
The southern part of the
Durgapur MC is dominated
by the built-up area. The latest
satellite image-driven NDBI
(2018) shows rapid growth of
the built-up area (BU) in this
parts, while other parts of the
study area remain nonbuilt-up areas
The built-up area mainly
predominated in the entire area
of Siliguri MC, although the
concentration of the BU can be
found in the central part of the
region. The NDBI values of
2006, 2011 and 2018 satellite
images signify this. However,
in recent times, satellite-driven
NDBI shows very efficiently
the BU of the MC
Normalised Difference
Vegetation Index
(NDVI)
The NDVI value of Kolkata has
slightly increased in the central
part of the city, whereas in the
outskirt, the health condition of
the vegetation is not good; here
the NDVI value remains less than
0.2 to 0.10
The NDVI values of the Asansol
shows that the value has been
decreasing from 2006 to 2011 and
in the recent time, i.e. 2018. A
healthy vegetation is found in the
eastern part of the Asansol
municipality (Fig. 8.3)
The NDVI value during
latest time period has been
decreasing (especially in
2011 images), mainly in the
northern and central
Durgapur MC. NDVI
somehow increased, but
overall health condition has
decreased from 2006 to 2018
The NDVI image of the
Siliguri shows that the
vegetation covers rapidly
decrease over the central
parts of the Siliguri
MC. The vegetation health
also decreases in recent
times (2018) as compared to
2011 images
Enhanced Built-Up
and Bareness Index
(EBBI)
The EBBI value of the city shows
major built-up area of the city,
recent time growth has been
marked very well by EBBI, the
reflectance value of EBBI in
recent times (2018) shows actual
condition, whereas TM satellite
images show low reflectance
value of built-up area which is
indicated by EBBI (Fig. 8.2)
The EBBI values lies between
−0.2
and 0 which shows the built-up
area. Henceforth, the recent year
map (2011 and 2018) of the Asansol
shows that the region, mainly the
central part of the Asansol MC,
remains as the main built-up area of
the study area. However, the EBBI
overestimated the growth of the
built-up area especially in the
central part of the city.
The EBBI value lies between
−0.2 and 0 which shows the
built-up area. Henceforth,
the recent year map of the
Durgapur MC shows that the
region, mainly the southcentral part, remains as the
most dominated built-up
area
The EBBI value of the city
shows major growth of
built-up area in Siliguri
MC. Mostly the
development of the built-up
area has been noticed in the
central part, and thereafter it
expands in the central and
northern parts, which is
easily demarcated by EBBI
(continued)
8 Spatio-Temporal Transformation of Urban Built-Up Areas for Sustainable…