

154
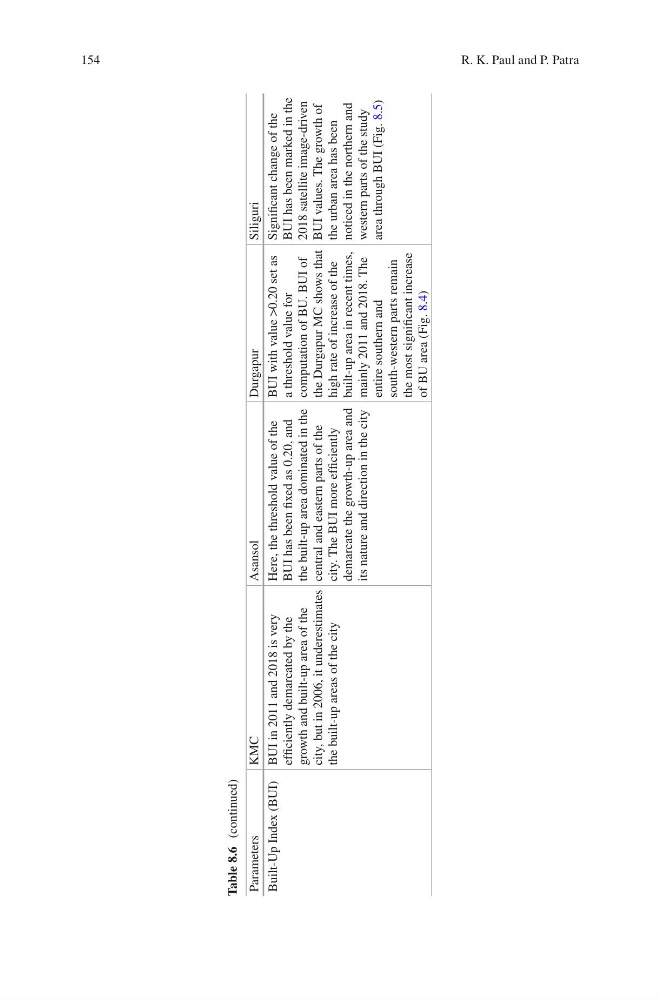
Table 8.6 (continued)
Parameters
KMC
Asansol
Durgapur
Siliguri
Built-Up Index (BUI) BUI in 2011 and 2018 is very
efficiently demarcated by the
growth and built-up area of the
city, but in 2006, it underestimates
the built-up areas of the city
Here, the threshold value of the
BUI has been fixed as 0.20, and
the built-up area dominated in the
central and eastern parts of the
city. The BUI more efficiently
demarcate the growth-up area and
its nature and direction in the city
BUI with value >0.20 set as
a threshold value for
computation of BU. BUI of
the Durgapur MC shows that
high rate of increase of the
built-up area in recent times,
mainly 2011 and 2018. The
entire southern and
south- western parts remain
the most significant increase
of BU area (Fig. 8.4)
Significant change of the
BUI has been marked in the
2018 satellite image-driven
BUI values. The growth of
the urban area has been
noticed in the northern and
western parts of the study
area through BUI (Fig. 8.5)
R. K. Paul and P. Patra
Table 8.6 (continued)
Parameters
KMC
Asansol
Durgapur
Siliguri
Built-Up Index (BUI) BUI in 2011 and 2018 is very
efficiently demarcated by the
growth and built-up area of the
city, but in 2006, it underestimates
the built-up areas of the city
Here, the threshold value of the
BUI has been fixed as 0.20, and
the built-up area dominated in the
central and eastern parts of the
city. The BUI more efficiently
demarcate the growth-up area and
its nature and direction in the city
BUI with value >0.20 set as
a threshold value for
computation of BU. BUI of
the Durgapur MC shows that
high rate of increase of the
built-up area in recent times,
mainly 2011 and 2018. The
entire southern and
south- western parts remain
the most significant increase
of BU area (Fig. 8.4)
Significant change of the
BUI has been marked in the
2018 satellite image-driven
BUI values. The growth of
the urban area has been
noticed in the northern and
western parts of the study
area through BUI (Fig. 8.5)
R. K. Paul and P. Patra