

141
The percentages of explanation of the influence of these factors have been
derived by the principal component analysis. The Component 1, 2 and 3 with all the
selected seven factors has been able to explain 87.172 percentages to the total variance significantly. Finally, based on the factor loadings, four factor scores have been
computed which have enormous significance in the final ranking of the dilapidated
buildings based on their overall fragility level. On the basis of the descending ordering of factor score 1, the Dilapidation Index is prepared for the 45 buildings and
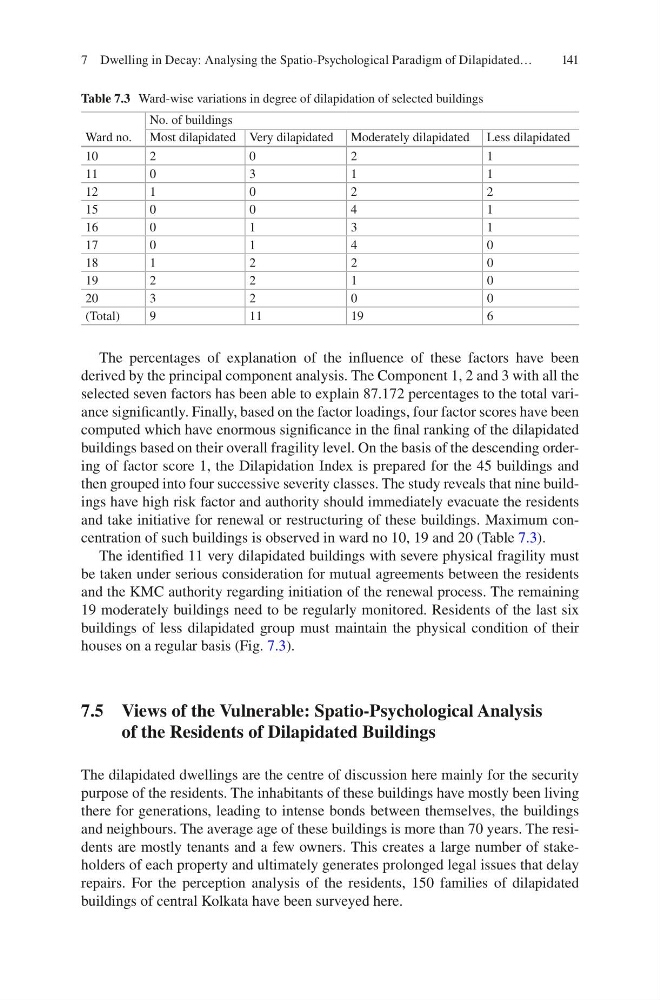
then grouped into four successive severity classes. The study reveals that nine buildings have high risk factor and authority should immediately evacuate the residents
and take initiative for renewal or restructuring of these buildings. Maximum concentration of such buildings is observed in ward no 10, 19 and 20 (Table 7.3).
The identified 11 very dilapidated buildings with severe physical fragility must
be taken under serious consideration for mutual agreements between the residents
and the KMC authority regarding initiation of the renewal process. The remaining
19 moderately buildings need to be regularly monitored. Residents of the last six
buildings of less dilapidated group must maintain the physical condition of their
houses on a regular basis (Fig. 7.3).
7.5 Views of the Vulnerable: Spatio-Psychological Analysis
of the Residents of Dilapidated Buildings
The dilapidated dwellings are the centre of discussion here mainly for the security
purpose of the residents. The inhabitants of these buildings have mostly been living
there for generations, leading to intense bonds between themselves, the buildings
and neighbours. The average age of these buildings is more than 70 years. The residents are mostly tenants and a few owners. This creates a large number of stakeholders of each property and ultimately generates prolonged legal issues that delay
repairs. For the perception analysis of the residents, 150 families of dilapidated
buildings of central Kolkata have been surveyed here.
Table 7.3 Ward-wise variations in degree of dilapidation of selected buildings
Ward no.
No. of buildings
Most dilapidated Very dilapidated Moderately dilapidated Less dilapidated
10
2
0
2
1
11
0
3
1
1
12
1
0
2
2
15
0
0
4
1
16
0
1
3
1
17
0
1
4
0
18
1
2
2
0
19
2
2
1
0
20
3
2
0
0
(Total)
9
11
19
6
7 Dwelling in Decay: Analysing the Spatio-Psychological Paradigm of Dilapidated…
The percentages of explanation of the influence of these factors have been
derived by the principal component analysis. The Component 1, 2 and 3 with all the
selected seven factors has been able to explain 87.172 percentages to the total variance significantly. Finally, based on the factor loadings, four factor scores have been
computed which have enormous significance in the final ranking of the dilapidated
buildings based on their overall fragility level. On the basis of the descending ordering of factor score 1, the Dilapidation Index is prepared for the 45 buildings and
then grouped into four successive severity classes. The study reveals that nine buildings have high risk factor and authority should immediately evacuate the residents
and take initiative for renewal or restructuring of these buildings. Maximum concentration of such buildings is observed in ward no 10, 19 and 20 (Table 7.3).
The identified 11 very dilapidated buildings with severe physical fragility must
be taken under serious consideration for mutual agreements between the residents
and the KMC authority regarding initiation of the renewal process. The remaining
19 moderately buildings need to be regularly monitored. Residents of the last six
buildings of less dilapidated group must maintain the physical condition of their
houses on a regular basis (Fig. 7.3).
7.5 Views of the Vulnerable: Spatio-Psychological Analysis
of the Residents of Dilapidated Buildings
The dilapidated dwellings are the centre of discussion here mainly for the security
purpose of the residents. The inhabitants of these buildings have mostly been living
there for generations, leading to intense bonds between themselves, the buildings
and neighbours. The average age of these buildings is more than 70 years. The residents are mostly tenants and a few owners. This creates a large number of stakeholders of each property and ultimately generates prolonged legal issues that delay
repairs. For the perception analysis of the residents, 150 families of dilapidated
buildings of central Kolkata have been surveyed here.
Table 7.3 Ward-wise variations in degree of dilapidation of selected buildings
Ward no.
No. of buildings
Most dilapidated Very dilapidated Moderately dilapidated Less dilapidated
10
2
0
2
1
11
0
3
1
1
12
1
0
2
2
15
0
0
4
1
16
0
1
3
1
17
0
1
4
0
18
1
2
2
0
19
2
2
1
0
20
3
2
0
0
(Total)
9
11
19
6
7 Dwelling in Decay: Analysing the Spatio-Psychological Paradigm of Dilapidated…