

140
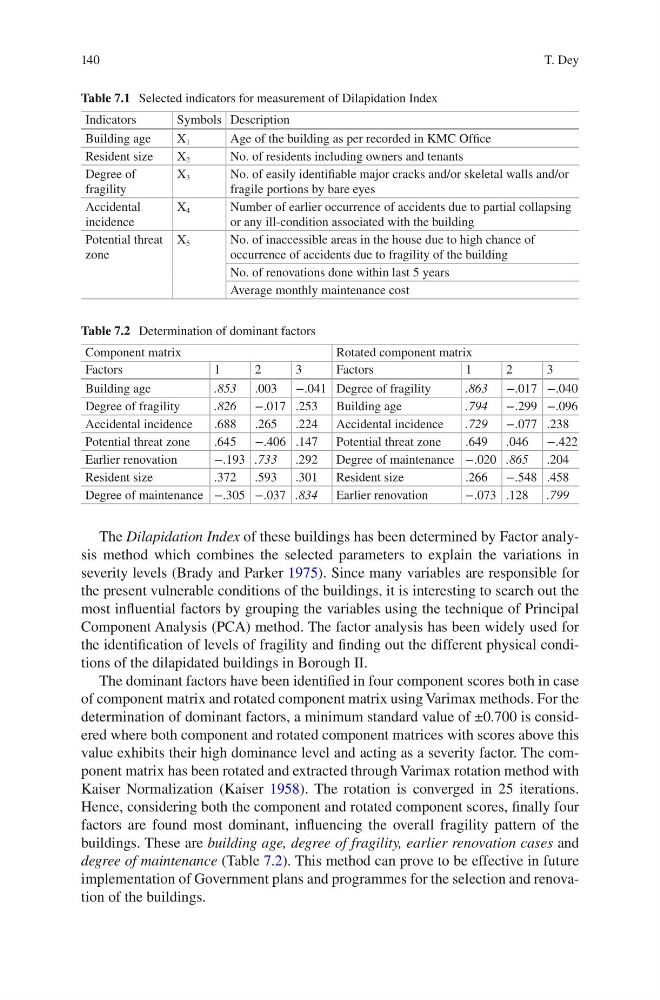
The Dilapidation Index of these buildings has been determined by Factor analysis method which combines the selected parameters to explain the variations in
severity levels (Brady and Parker 1975). Since many variables are responsible for
the present vulnerable conditions of the buildings, it is interesting to search out the
most influential factors by grouping the variables using the technique of Principal
Component Analysis (PCA) method. The factor analysis has been widely used for
the identification of levels of fragility and finding out the different physical conditions of the dilapidated buildings in Borough II.
The dominant factors have been identified in four component scores both in case
of component matrix and rotated component matrix using Varimax methods. For the
determination of dominant factors, a minimum standard value of ±0.700 is considered where both component and rotated component matrices with scores above this
value exhibits their high dominance level and acting as a severity factor. The component matrix has been rotated and extracted through Varimax rotation method with
Kaiser Normalization (Kaiser 1958). The rotation is converged in 25 iterations.
Hence, considering both the component and rotated component scores, finally four
factors are found most dominant, influencing the overall fragility pattern of the
buildings. These are building age, degree of fragility, earlier renovation cases and
degree of maintenance (Table 7.2). This method can prove to be effective in future
implementation of Government plans and programmes for the selection and renovation of the buildings.
Table 7.1 Selected indicators for measurement of Dilapidation Index
Indicators
Symbols Description
Building age
X 1
Age of the building as per recorded in KMC Office
Resident size
X 2
No. of residents including owners and tenants
Degree of
fragility
X 3
No. of easily identifiable major cracks and/or skeletal walls and/or
fragile portions by bare eyes
Accidental
incidence
X 4
Number of earlier occurrence of accidents due to partial collapsing
or any ill-condition associated with the building
Potential threat
zone
X 5
No. of inaccessible areas in the house due to high chance of
occurrence of accidents due to fragility of the building
No. of renovations done within last 5 years
Average monthly maintenance cost
Table 7.2 Determination of dominant factors
Component matrix
Rotated component matrix
Factors
1
2
3
Factors
1
2
3
Building age
.853 .003 −.041 Degree of fragility
.863 −.017 −.040
Degree of fragility
.826 −.017 .253 Building age
.794 −.299 −.096
Accidental incidence
.688 .265 .224 Accidental incidence
.729 −.077 .238
Potential threat zone
.645 −.406 .147 Potential threat zone
.649 .046 −.422
Earlier renovation
−.193 .733 .292 Degree of maintenance −.020 .865 .204
Resident size
.372 .593 .301 Resident size
.266 −.548 .458
Degree of maintenance −.305 −.037 .834 Earlier renovation
−.073 .128 .799
T. Dey
The Dilapidation Index of these buildings has been determined by Factor analysis method which combines the selected parameters to explain the variations in
severity levels (Brady and Parker 1975). Since many variables are responsible for
the present vulnerable conditions of the buildings, it is interesting to search out the
most influential factors by grouping the variables using the technique of Principal
Component Analysis (PCA) method. The factor analysis has been widely used for
the identification of levels of fragility and finding out the different physical conditions of the dilapidated buildings in Borough II.
The dominant factors have been identified in four component scores both in case
of component matrix and rotated component matrix using Varimax methods. For the
determination of dominant factors, a minimum standard value of ±0.700 is considered where both component and rotated component matrices with scores above this
value exhibits their high dominance level and acting as a severity factor. The component matrix has been rotated and extracted through Varimax rotation method with
Kaiser Normalization (Kaiser 1958). The rotation is converged in 25 iterations.
Hence, considering both the component and rotated component scores, finally four
factors are found most dominant, influencing the overall fragility pattern of the
buildings. These are building age, degree of fragility, earlier renovation cases and
degree of maintenance (Table 7.2). This method can prove to be effective in future
implementation of Government plans and programmes for the selection and renovation of the buildings.
Table 7.1 Selected indicators for measurement of Dilapidation Index
Indicators
Symbols Description
Building age
X 1
Age of the building as per recorded in KMC Office
Resident size
X 2
No. of residents including owners and tenants
Degree of
fragility
X 3
No. of easily identifiable major cracks and/or skeletal walls and/or
fragile portions by bare eyes
Accidental
incidence
X 4
Number of earlier occurrence of accidents due to partial collapsing
or any ill-condition associated with the building
Potential threat
zone
X 5
No. of inaccessible areas in the house due to high chance of
occurrence of accidents due to fragility of the building
No. of renovations done within last 5 years
Average monthly maintenance cost
Table 7.2 Determination of dominant factors
Component matrix
Rotated component matrix
Factors
1
2
3
Factors
1
2
3
Building age
.853 .003 −.041 Degree of fragility
.863 −.017 −.040
Degree of fragility
.826 −.017 .253 Building age
.794 −.299 −.096
Accidental incidence
.688 .265 .224 Accidental incidence
.729 −.077 .238
Potential threat zone
.645 −.406 .147 Potential threat zone
.649 .046 −.422
Earlier renovation
−.193 .733 .292 Degree of maintenance −.020 .865 .204
Resident size
.372 .593 .301 Resident size
.266 −.548 .458
Degree of maintenance −.305 −.037 .834 Earlier renovation
−.073 .128 .799
T. Dey