

Advances in Neural Signal Processing
86
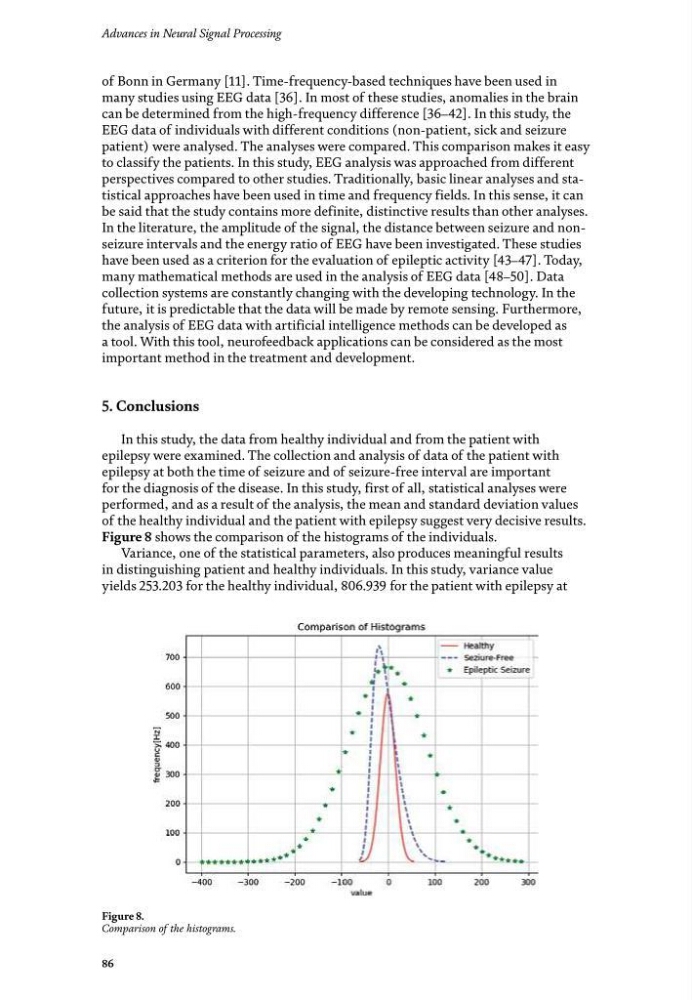
Figure 8.
Comparison of the histograms.
of Bonn in Germany [11]. Time-frequency-based techniques have been used in
many studies using EEG data [36]. In most of these studies, anomalies in the brain
can be determined from the high-frequency difference [36–42]. In this study, the
EEG data of individuals with different conditions (non-patient, sick and seizure
patient) were analysed. The analyses were compared. This comparison makes it easy
to classify the patients. In this study, EEG analysis was approached from different
perspectives compared to other studies. Traditionally, basic linear analyses and statistical approaches have been used in time and frequency fields. In this sense, it can
be said that the study contains more definite, distinctive results than other analyses.
In the literature, the amplitude of the signal, the distance between seizure and nonseizure intervals and the energy ratio of EEG have been investigated. These studies
have been used as a criterion for the evaluation of epileptic activity [43–47]. Today,
many mathematical methods are used in the analysis of EEG data [48–50]. Data
collection systems are constantly changing with the developing technology. In the
future, it is predictable that the data will be made by remote sensing. Furthermore,
the analysis of EEG data with artificial intelligence methods can be developed as
a tool. With this tool, neurofeedback applications can be considered as the most
important method in the treatment and development.
5. Conclusions
In this study, the data from healthy individual and from the patient with
epilepsy were examined. The collection and analysis of data of the patient with
epilepsy at both the time of seizure and of seizure-free interval are important
for the diagnosis of the disease. In this study, first of all, statistical analyses were
performed, and as a result of the analysis, the mean and standard deviation values
of the healthy individual and the patient with epilepsy suggest very decisive results.
Figure 8 shows the comparison of the histograms of the individuals.
Variance, one of the statistical parameters, also produces meaningful results
in distinguishing patient and healthy individuals. In this study, variance value
yields 253.203 for the healthy individual, 806.939 for the patient with epilepsy at
86
Figure 8.
Comparison of the histograms.
of Bonn in Germany [11]. Time-frequency-based techniques have been used in
many studies using EEG data [36]. In most of these studies, anomalies in the brain
can be determined from the high-frequency difference [36–42]. In this study, the
EEG data of individuals with different conditions (non-patient, sick and seizure
patient) were analysed. The analyses were compared. This comparison makes it easy
to classify the patients. In this study, EEG analysis was approached from different
perspectives compared to other studies. Traditionally, basic linear analyses and statistical approaches have been used in time and frequency fields. In this sense, it can
be said that the study contains more definite, distinctive results than other analyses.
In the literature, the amplitude of the signal, the distance between seizure and nonseizure intervals and the energy ratio of EEG have been investigated. These studies
have been used as a criterion for the evaluation of epileptic activity [43–47]. Today,
many mathematical methods are used in the analysis of EEG data [48–50]. Data
collection systems are constantly changing with the developing technology. In the
future, it is predictable that the data will be made by remote sensing. Furthermore,
the analysis of EEG data with artificial intelligence methods can be developed as
a tool. With this tool, neurofeedback applications can be considered as the most
important method in the treatment and development.
5. Conclusions
In this study, the data from healthy individual and from the patient with
epilepsy were examined. The collection and analysis of data of the patient with
epilepsy at both the time of seizure and of seizure-free interval are important
for the diagnosis of the disease. In this study, first of all, statistical analyses were
performed, and as a result of the analysis, the mean and standard deviation values
of the healthy individual and the patient with epilepsy suggest very decisive results.
Figure 8 shows the comparison of the histograms of the individuals.
Variance, one of the statistical parameters, also produces meaningful results
in distinguishing patient and healthy individuals. In this study, variance value
yields 253.203 for the healthy individual, 806.939 for the patient with epilepsy at