

85
Detection of Epileptic Seizure Using STFT and Statistical Analysis
DOI: http://dx.doi.org/10.5772/intechopen.89026
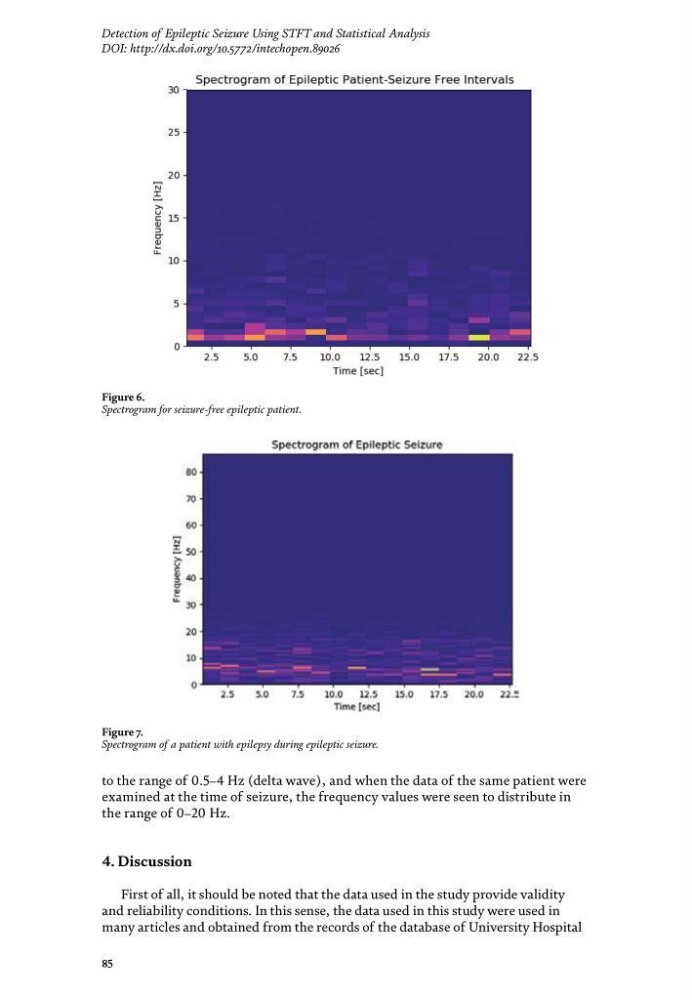
to the range of 0.5–4 Hz (delta wave), and when the data of the same patient were
examined at the time of seizure, the frequency values were seen to distribute in
the range of 0–20 Hz.
4. Discussion
First of all, it should be noted that the data used in the study provide validity
and reliability conditions. In this sense, the data used in this study were used in
many articles and obtained from the records of the database of University Hospital
Figure 6.
Spectrogram for seizure-free epileptic patient.
Figure 7.
Spectrogram of a patient with epilepsy during epileptic seizure.
Detection of Epileptic Seizure Using STFT and Statistical Analysis
DOI: http://dx.doi.org/10.5772/intechopen.89026
to the range of 0.5–4 Hz (delta wave), and when the data of the same patient were
examined at the time of seizure, the frequency values were seen to distribute in
the range of 0–20 Hz.
4. Discussion
First of all, it should be noted that the data used in the study provide validity
and reliability conditions. In this sense, the data used in this study were used in
many articles and obtained from the records of the database of University Hospital
Figure 6.
Spectrogram for seizure-free epileptic patient.
Figure 7.
Spectrogram of a patient with epilepsy during epileptic seizure.