

Advances in Neural Signal Processing
82
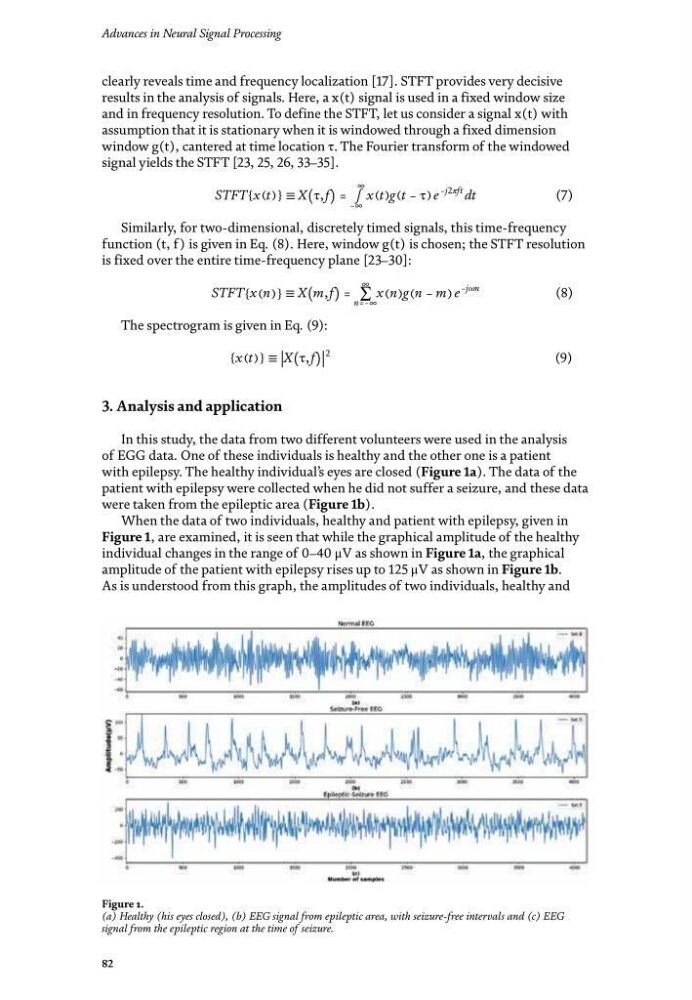
Figure 1.
(a) Healthy (his eyes closed), (b) EEG signal from epileptic area, with seizure-free intervals and (c) EEG
signal from the epileptic region at the time of seizure.
clearly reveals time and frequency localization [17]. STFT provides very decisive
results in the analysis of signals. Here, a x(t) signal is used in a fixed window size
and in frequency resolution. To define the STFT, let us consider a signal x(t) with
assumption that it is stationary when it is windowed through a fixed dimension
window g(t), cantered at time location τ. The Fourier transform of the windowed
signal yields the STFT [23, 25, 26, 33–35].
STFT {x (t) } ≡ X ( τ, f ) = ∫
−∞
∞
x (t) g (t − τ) e
−j2í µí¼í µí¼ft dt
(7)
Similarly, for two-dimensional, discretely timed signals, this time-frequency
function (t, f) is given in Eq. (8). Here, window g(t) is chosen; the STFT resolution
is fixed over the entire time-frequency plane [23–30]:
STFT {x (n) } ≡ X ( m, f ) = ∑
n=−∞
∞
x (n) g (n − m) e
−jí µí¼í µí¼n
(8)
The spectrogram is given in Eq. (9):
{x (t) } ≡ |X ( τ, f ) |
2
(9)
3. Analysis and application
In this study, the data from two different volunteers were used in the analysis
of EGG data. One of these individuals is healthy and the other one is a patient
with epilepsy. The healthy individual’s eyes are closed (Figure 1a). The data of the
patient with epilepsy were collected when he did not suffer a seizure, and these data
were taken from the epileptic area (Figure 1b).
When the data of two individuals, healthy and patient with epilepsy, given in
Figure 1, are examined, it is seen that while the graphical amplitude of the healthy
individual changes in the range of 0–40 μV as shown in Figure 1a, the graphical
amplitude of the patient with epilepsy rises up to 125 μV as shown in Figure 1b.
As is understood from this graph, the amplitudes of two individuals, healthy and
82
Figure 1.
(a) Healthy (his eyes closed), (b) EEG signal from epileptic area, with seizure-free intervals and (c) EEG
signal from the epileptic region at the time of seizure.
clearly reveals time and frequency localization [17]. STFT provides very decisive
results in the analysis of signals. Here, a x(t) signal is used in a fixed window size
and in frequency resolution. To define the STFT, let us consider a signal x(t) with
assumption that it is stationary when it is windowed through a fixed dimension
window g(t), cantered at time location τ. The Fourier transform of the windowed
signal yields the STFT [23, 25, 26, 33–35].
STFT {x (t) } ≡ X ( τ, f ) = ∫
−∞
∞
x (t) g (t − τ) e
−j2í µí¼í µí¼ft dt
(7)
Similarly, for two-dimensional, discretely timed signals, this time-frequency
function (t, f) is given in Eq. (8). Here, window g(t) is chosen; the STFT resolution
is fixed over the entire time-frequency plane [23–30]:
STFT {x (n) } ≡ X ( m, f ) = ∑
n=−∞
∞
x (n) g (n − m) e
−jí µí¼í µí¼n
(8)
The spectrogram is given in Eq. (9):
{x (t) } ≡ |X ( τ, f ) |
2
(9)
3. Analysis and application
In this study, the data from two different volunteers were used in the analysis
of EGG data. One of these individuals is healthy and the other one is a patient
with epilepsy. The healthy individual’s eyes are closed (Figure 1a). The data of the
patient with epilepsy were collected when he did not suffer a seizure, and these data
were taken from the epileptic area (Figure 1b).
When the data of two individuals, healthy and patient with epilepsy, given in
Figure 1, are examined, it is seen that while the graphical amplitude of the healthy
individual changes in the range of 0–40 μV as shown in Figure 1a, the graphical
amplitude of the patient with epilepsy rises up to 125 μV as shown in Figure 1b.
As is understood from this graph, the amplitudes of two individuals, healthy and