

83
Detection of Epileptic Seizure Using STFT and Statistical Analysis
DOI: http://dx.doi.org/10.5772/intechopen.89026
patient with epilepsy, are sufficient to clearly diagnose the disease. The graphical amplitude gets maximum value despite the absence of seizure as shown in
Figure 1b. However, the moment when the same individual has a seizure shown in
Figure 1c), the amplitudes are seen to increase much. These graphs clearly indicate
whether the individual is a patient with epilepsy and whether those patients with
epilepsy suffer a seizure (Table 1).
When the statistical parameters of the data from the healthy individual and of
the epileptic area of the patient with epilepsy are examined, it is seen that there are
significant differences both in the mean value and in the standard deviation. The
mean value yields −1.347 in the healthy individual, −5.24 in the patient with epilepsy and − 2.521 when the patient with epilepsy suffers a seizure. As a result of the
analysis, standard deviation values can be said to be quite decisive in the diagnosis
of the disease. However, while healthy individual and the patient with epilepsy
can be distinguished from each other in histograms, the histogram shows a normal
distribution at the time of seizure.
In this context, histogram graphs can only be used in the diagnosis of epilepsy, but
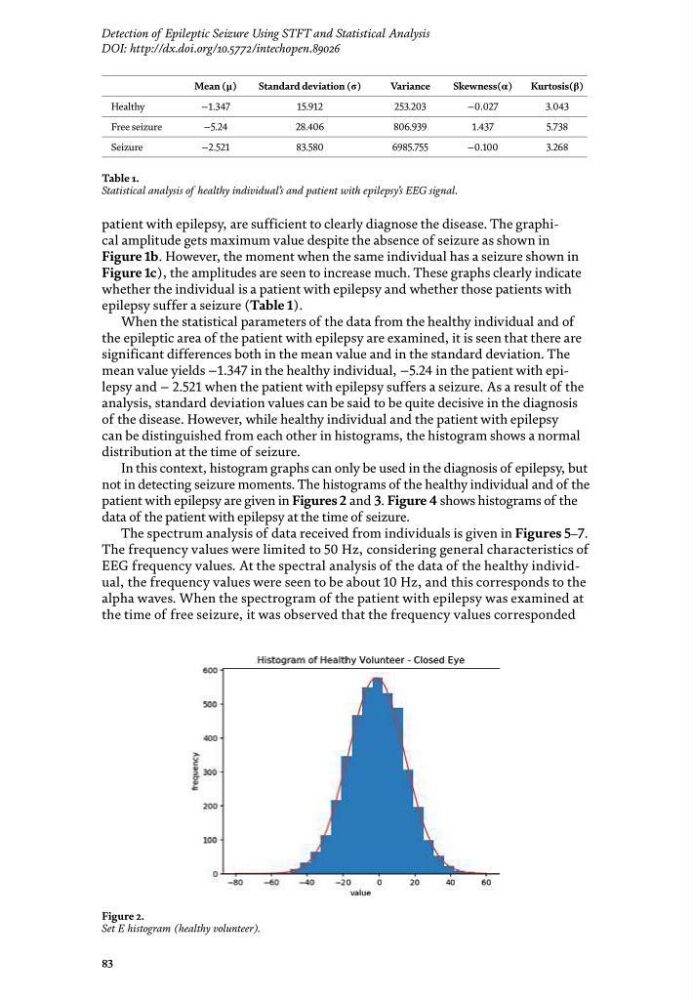
not in detecting seizure moments. The histograms of the healthy individual and of the
patient with epilepsy are given in Figures 2 and 3. Figure 4 shows histograms of the
data of the patient with epilepsy at the time of seizure.
The spectrum analysis of data received from individuals is given in Figures 5–7.
The frequency values were limited to 50 Hz, considering general characteristics of
EEG frequency values. At the spectral analysis of the data of the healthy individual, the frequency values were seen to be about 10 Hz, and this corresponds to the
alpha waves. When the spectrogram of the patient with epilepsy was examined at
the time of free seizure, it was observed that the frequency values corresponded
Mean (μ)
Standard deviation (σ)
Variance
Skewness(α)
Kurtosis(β)
Healthy
−1.347
15.912
253.203
−0.027
3.043
Free seizure
−5.24
28.406
806.939
1.437
5.738
Seizure
−2.521
83.580
6985.755
−0.100
3.268
Table 1.
Statistical analysis of healthy individual’s and patient with epilepsy’s EEG signal.
Figure 2.
Set E histogram (healthy volunteer).
Detection of Epileptic Seizure Using STFT and Statistical Analysis
DOI: http://dx.doi.org/10.5772/intechopen.89026
patient with epilepsy, are sufficient to clearly diagnose the disease. The graphical amplitude gets maximum value despite the absence of seizure as shown in
Figure 1b. However, the moment when the same individual has a seizure shown in
Figure 1c), the amplitudes are seen to increase much. These graphs clearly indicate
whether the individual is a patient with epilepsy and whether those patients with
epilepsy suffer a seizure (Table 1).
When the statistical parameters of the data from the healthy individual and of
the epileptic area of the patient with epilepsy are examined, it is seen that there are
significant differences both in the mean value and in the standard deviation. The
mean value yields −1.347 in the healthy individual, −5.24 in the patient with epilepsy and − 2.521 when the patient with epilepsy suffers a seizure. As a result of the
analysis, standard deviation values can be said to be quite decisive in the diagnosis
of the disease. However, while healthy individual and the patient with epilepsy
can be distinguished from each other in histograms, the histogram shows a normal
distribution at the time of seizure.
In this context, histogram graphs can only be used in the diagnosis of epilepsy, but
not in detecting seizure moments. The histograms of the healthy individual and of the
patient with epilepsy are given in Figures 2 and 3. Figure 4 shows histograms of the
data of the patient with epilepsy at the time of seizure.
The spectrum analysis of data received from individuals is given in Figures 5–7.
The frequency values were limited to 50 Hz, considering general characteristics of
EEG frequency values. At the spectral analysis of the data of the healthy individual, the frequency values were seen to be about 10 Hz, and this corresponds to the
alpha waves. When the spectrogram of the patient with epilepsy was examined at
the time of free seizure, it was observed that the frequency values corresponded
Mean (μ)
Standard deviation (σ)
Variance
Skewness(α)
Kurtosis(β)
Healthy
−1.347
15.912
253.203
−0.027
3.043
Free seizure
−5.24
28.406
806.939
1.437
5.738
Seizure
−2.521
83.580
6985.755
−0.100
3.268
Table 1.
Statistical analysis of healthy individual’s and patient with epilepsy’s EEG signal.
Figure 2.
Set E histogram (healthy volunteer).