

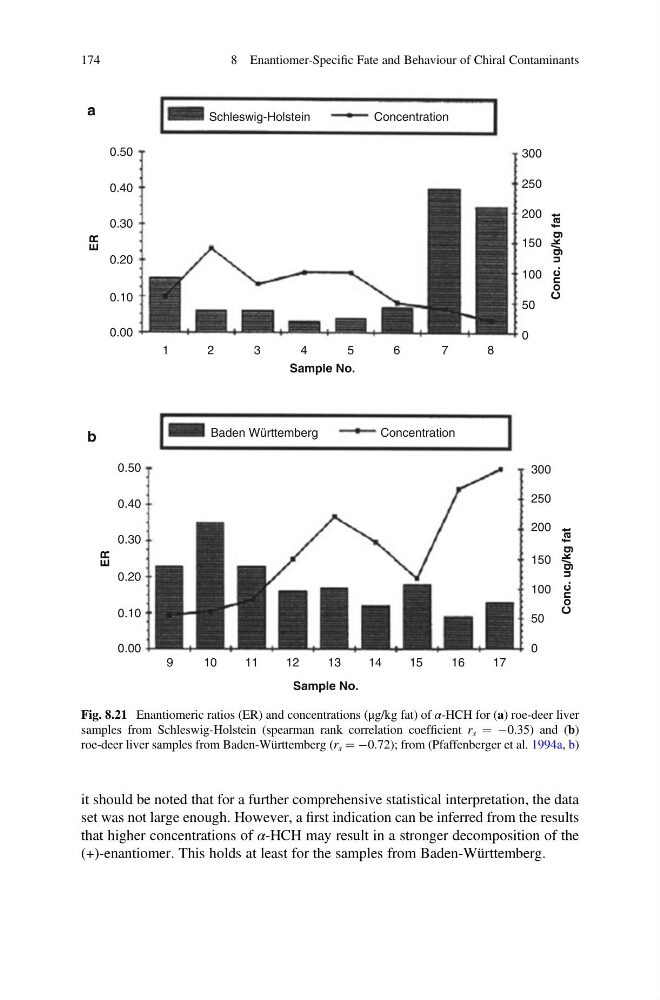
it should be noted that for a further comprehensive statistical interpretation, the data
set was not large enough. However, a first indication can be inferred from the results
that higher concentrations of α-HCH may result in a stronger decomposition of the
(+)-enantiomer. This holds at least for the samples from Baden-Württemberg.
0.50
Schleswig-Holstein
Concentration
0.40
0.30
0.20
0.10
0.00
1
2
3
4
Sample No.
5
6
7
8
0
50
Conc. ug/kg fat
ER
a
b
100
150
200
250
300
0.50
Baden Württemberg
Concentration
0.40
0.30
0.20
0.10
0.00
9
1 0
1 1
1 2
1 3
1 4
1 5
1 6
1 7
Sample No.
0
50
Conc. ug/kg fat
ER
100
150
200
250
300
Fig. 8.21 Enantiomeric ratios (ER) and concentrations (μg/kg fat) of α-HCH for (a) roe-deer liver
samples from Schleswig-Holstein (spearman rank correlation coefficient r s ¼ À0.35) and (b)
roe-deer liver samples from Baden-Württemberg (r s ¼ À0.72); from (Pfaffenberger et al. 1994a, b)
174
8 Enantiomer-Specific Fate and Behaviour of Chiral Contaminants
set was not large enough. However, a first indication can be inferred from the results
that higher concentrations of α-HCH may result in a stronger decomposition of the
(+)-enantiomer. This holds at least for the samples from Baden-Württemberg.
0.50
Schleswig-Holstein
Concentration
0.40
0.30
0.20
0.10
0.00
1
2
3
4
Sample No.
5
6
7
8
0
50
Conc. ug/kg fat
ER
a
b
100
150
200
250
300
0.50
Baden Württemberg
Concentration
0.40
0.30
0.20
0.10
0.00
9
1 0
1 1
1 2
1 3
1 4
1 5
1 6
1 7
Sample No.
0
50
Conc. ug/kg fat
ER
100
150
200
250
300
Fig. 8.21 Enantiomeric ratios (ER) and concentrations (μg/kg fat) of α-HCH for (a) roe-deer liver
samples from Schleswig-Holstein (spearman rank correlation coefficient r s ¼ À0.35) and (b)
roe-deer liver samples from Baden-Württemberg (r s ¼ À0.72); from (Pfaffenberger et al. 1994a, b)
174
8 Enantiomer-Specific Fate and Behaviour of Chiral Contaminants