

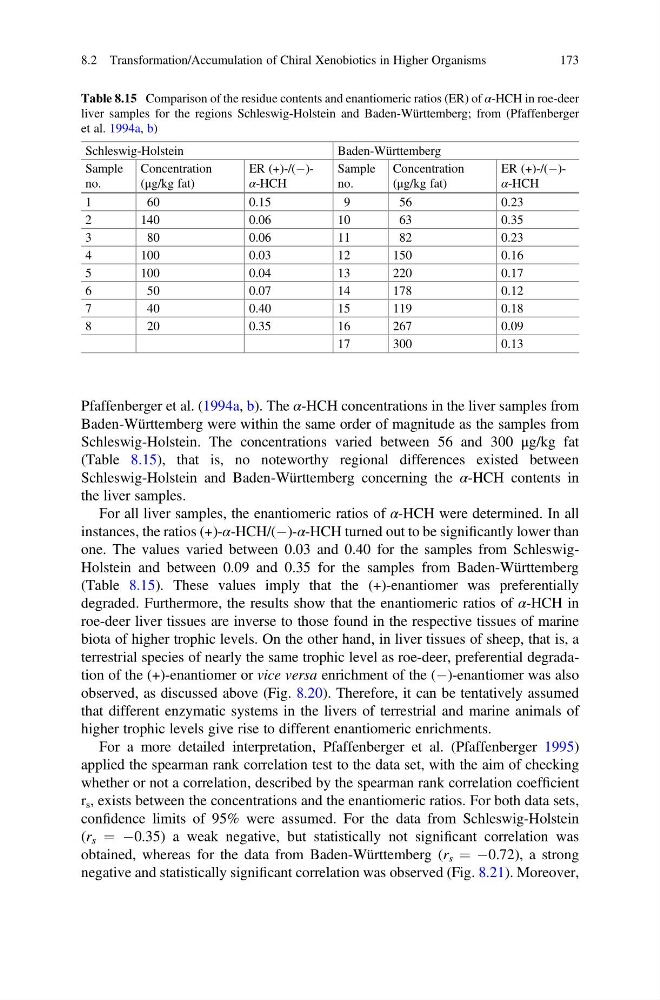
Pfaffenberger et al. (1994a, b). The α-HCH concentrations in the liver samples from
Baden-Württemberg were within the same order of magnitude as the samples from
Schleswig-Holstein. The concentrations varied between 56 and 300 μg/kg fat
(Table 8.15), that is, no noteworthy regional differences existed between
Schleswig-Holstein and Baden-Württemberg concerning the α-HCH contents in
the liver samples.
For all liver samples, the enantiomeric ratios of α-HCH were determined. In all
instances, the ratios (+)-α-HCH/(À)-α-HCH turned out to be significantly lower than
one. The values varied between 0.03 and 0.40 for the samples from SchleswigHolstein and between 0.09 and 0.35 for the samples from Baden-Württemberg
(Table 8.15). These values imply that the (+)-enantiomer was preferentially
degraded. Furthermore, the results show that the enantiomeric ratios of α-HCH in
roe-deer liver tissues are inverse to those found in the respective tissues of marine
biota of higher trophic levels. On the other hand, in liver tissues of sheep, that is, a
terrestrial species of nearly the same trophic level as roe-deer, preferential degradation of the (+)-enantiomer or vice versa enrichment of the (À)-enantiomer was also
observed, as discussed above (Fig. 8.20). Therefore, it can be tentatively assumed
that different enzymatic systems in the livers of terrestrial and marine animals of
higher trophic levels give rise to different enantiomeric enrichments.
For a more detailed interpretation, Pfaffenberger et al. (Pfaffenberger 1995)
applied the spearman rank correlation test to the data set, with the aim of checking
whether or not a correlation, described by the spearman rank correlation coefficient
r s , exists between the concentrations and the enantiomeric ratios. For both data sets,
confidence limits of 95% were assumed. For the data from Schleswig-Holstein
(r s ¼ À0.35) a weak negative, but statistically not significant correlation was
obtained, whereas for the data from Baden-Württemberg (r s ¼ À0.72), a strong
negative and statistically significant correlation was observed (Fig. 8.21). Moreover,
Table 8.15 Comparison of the residue contents and enantiomeric ratios (ER) of α-HCH in roe-deer
liver samples for the regions Schleswig-Holstein and Baden-Württemberg; from (Pfaffenberger
et al. 1994a, b)
Schleswig-Holstein
Baden-Württemberg
Sample
no.
Concentration
(μg/kg fat)
ER (+)-/(À)α-HCH
Sample
no.
Concentration
(μg/kg fat)
ER (+)-/(À)α-HCH
1
60
0.15
9
56
0.23
2
140
0.06
10
63
0.35
3
80
0.06
11
82
0.23
4
100
0.03
12
150
0.16
5
100
0.04
13
220
0.17
6
50
0.07
14
178
0.12
7
40
0.40
15
119
0.18
8
20
0.35
16
267
0.09
17
300
0.13
8.2 Transformation/Accumulation of Chiral Xenobiotics in Higher Organisms
173
Baden-Württemberg were within the same order of magnitude as the samples from
Schleswig-Holstein. The concentrations varied between 56 and 300 μg/kg fat
(Table 8.15), that is, no noteworthy regional differences existed between
Schleswig-Holstein and Baden-Württemberg concerning the α-HCH contents in
the liver samples.
For all liver samples, the enantiomeric ratios of α-HCH were determined. In all
instances, the ratios (+)-α-HCH/(À)-α-HCH turned out to be significantly lower than
one. The values varied between 0.03 and 0.40 for the samples from SchleswigHolstein and between 0.09 and 0.35 for the samples from Baden-Württemberg
(Table 8.15). These values imply that the (+)-enantiomer was preferentially
degraded. Furthermore, the results show that the enantiomeric ratios of α-HCH in
roe-deer liver tissues are inverse to those found in the respective tissues of marine
biota of higher trophic levels. On the other hand, in liver tissues of sheep, that is, a
terrestrial species of nearly the same trophic level as roe-deer, preferential degradation of the (+)-enantiomer or vice versa enrichment of the (À)-enantiomer was also
observed, as discussed above (Fig. 8.20). Therefore, it can be tentatively assumed
that different enzymatic systems in the livers of terrestrial and marine animals of
higher trophic levels give rise to different enantiomeric enrichments.
For a more detailed interpretation, Pfaffenberger et al. (Pfaffenberger 1995)
applied the spearman rank correlation test to the data set, with the aim of checking
whether or not a correlation, described by the spearman rank correlation coefficient
r s , exists between the concentrations and the enantiomeric ratios. For both data sets,
confidence limits of 95% were assumed. For the data from Schleswig-Holstein
(r s ¼ À0.35) a weak negative, but statistically not significant correlation was
obtained, whereas for the data from Baden-Württemberg (r s ¼ À0.72), a strong
negative and statistically significant correlation was observed (Fig. 8.21). Moreover,
Table 8.15 Comparison of the residue contents and enantiomeric ratios (ER) of α-HCH in roe-deer
liver samples for the regions Schleswig-Holstein and Baden-Württemberg; from (Pfaffenberger
et al. 1994a, b)
Schleswig-Holstein
Baden-Württemberg
Sample
no.
Concentration
(μg/kg fat)
ER (+)-/(À)α-HCH
Sample
no.
Concentration
(μg/kg fat)
ER (+)-/(À)α-HCH
1
60
0.15
9
56
0.23
2
140
0.06
10
63
0.35
3
80
0.06
11
82
0.23
4
100
0.03
12
150
0.16
5
100
0.04
13
220
0.17
6
50
0.07
14
178
0.12
7
40
0.40
15
119
0.18
8
20
0.35
16
267
0.09
17
300
0.13
8.2 Transformation/Accumulation of Chiral Xenobiotics in Higher Organisms
173